The pitch: We don't start with button colors and layout tweaks. We start with the changes that directly affect your unit economics — pricing, offer structure, shipping thresholds, bundles, post-purchase upsells. These Tier 1 experiments consistently produce 15-40% lifts and resolve faster than surface-level changes. Once the economics are optimized, we layer in Tier 2 structural improvements.
What we've already done: We built a psychographic customer profile from 80+ of your real customer reviews, and our team has completed a preliminary site analysis identifying seven specific Tier 1 experiment opportunities for your store.
What you get: based on three comparable engagements, expected 12-month impact of a 15 to 20% conversion rate lift and $1M+ in cumulative revenue.
Price: performance-based. Month one is performance-only with no retainer — you pay nothing unless an experiment wins. Month two onward, $3,000 monthly floor or one month of measured uplift, whichever is higher. Capped at $10,000. No lock-in.
Proof: 21 experiments documented in this proposal across 11 clients, with real results. Three full case studies from comparable engagements (8x to 15x ROI).
Next step: a 30-minute call with Tim Davidson to walk through your current metrics together, confirm the opportunity size, and answer anything outstanding. tim@cleancommit.io.
Most CRO agencies start with the easy stuff. Button colors, headline copy, badge placement. Those changes are low-risk and fast to ship, but they rarely move the needle in a meaningful way.
We take a different approach. We classify every experiment into three tiers based on how directly it affects your unit economics, and we prioritize accordingly.
| Tier | What it changes | Expected impact | Examples |
|---|---|---|---|
| Tier 1 | What the customer buys, pays, or receives | 15-40%+ lift | Pricing, shipping thresholds, bundles, offers, subscription models, post-purchase upsells |
| Tier 2 | How the customer gets to the purchase | 8-20% lift | Navigation, checkout flow, cart architecture, search, cross-sell placement, page structure |
| Tier 3 | How existing elements look, read, or feel | 2-8% lift | Copy, colors, layout, imagery, badges, trust signals, social proof styling |
This isn't guesswork. It's backed by meta-analyses across thousands of experiments. Wharton's study of 2,732 tests confirmed that pricing and offer experiments produce the largest effect sizes of any category. Browne & Jones analyzed 6,700 experiments and found that 90% of tests produce less than 1.2% RPV lift. The only way to consistently break through the noise is to test at the proposition level first.
Our approach for TooTimid: We start with Tier 1. These experiments finish faster, produce larger effects, and compound more aggressively. Once the big levers are optimized, we blend in Tier 2 changes. Tier 3 comes last, if at all, and only when the higher tiers are exhausted.
The simple test: would the customer's bank statement look different? If yes, it's Tier 1.
10 Tier 1 and 11 Tier 2 experiments we've run across our client base, with the results.
| # | Tier | Experiment | Client | Key Result |
|---|---|---|---|---|
| 1 | T1 | Price increase on hero SKUs | One Quiet Mind | +42.5% CVR, +33.4% RPV |
| 2 | T1 | Free shipping threshold optimization | AFTCO | +22% AOV, +8% net revenue |
| 3 | T1 | Starter bundle introduction | Codeword | +31% AOV |
| 4 | T1 | Gift with purchase vs flat discount | AFTCO | +24% RPV |
| 5 | T1 | Subscribe & save on consumables | Gum of Gods | +18% RPV, +2.4x reorder rate |
| 6 | T1 | Discount removal on flagship | AnyAge Wear | +19% margin, +38% checkout rate |
| 7 | T1 | Spend-and-save threshold tiers | Marsh Wear | +26% AOV |
| 8 | T1 | Post-purchase one-click upsell | HashStash | +21% AOV, 18% acceptance rate |
| 9 | T1 | Starter kit for new customers | Overland Addict | +34% new visitor CVR |
| 10 | T1 | Volume discount incentive in cart | Marsh Wear | +28% RPV |
| 11 | T2 | Desktop sticky navbar | AFTCO | +9.6% RPV |
| 12 | T2 | Homepage UGC carousel | Codeword | +6.1% CVR, -10.5% bounce |
| 13 | T2 | Cross-sell pop-up at add-to-cart | Marsh Wear | +29% RPV, +13% AOV |
| 14 | T2 | Free gift callout on PDP | Peluva | +18.8% RPV |
| 15 | T2 | Homepage reskin with category cards | Overland Addict | +90% CVR |
| 16 | T2 | Product card differentiation | Gum of Gods | +11.5% CVR |
| 17 | T2 | Single column collection layout | AnyAge Wear | +6.6% ATC rate |
| 18 | T2 | Mobile navigation redesign | Q30 | +19.2% CVR, +22.1% RPV |
| 19 | T2 | Popup redesign & delay | Q30 | +7.9% CVR, +14.3% ATC |
| 20 | T2 | Cart vs quiz checkout flow | Gum of Gods | +44.1% RPV |
| 21 | T2 | Sale countdown timer | BetterGuards | +12% CVR, +8% RPV |
These experiments don't make the site look prettier. They change what the customer pays, receives, or how the offer is structured. They're harder to implement and require more conviction, but they consistently produce the largest, fastest results.
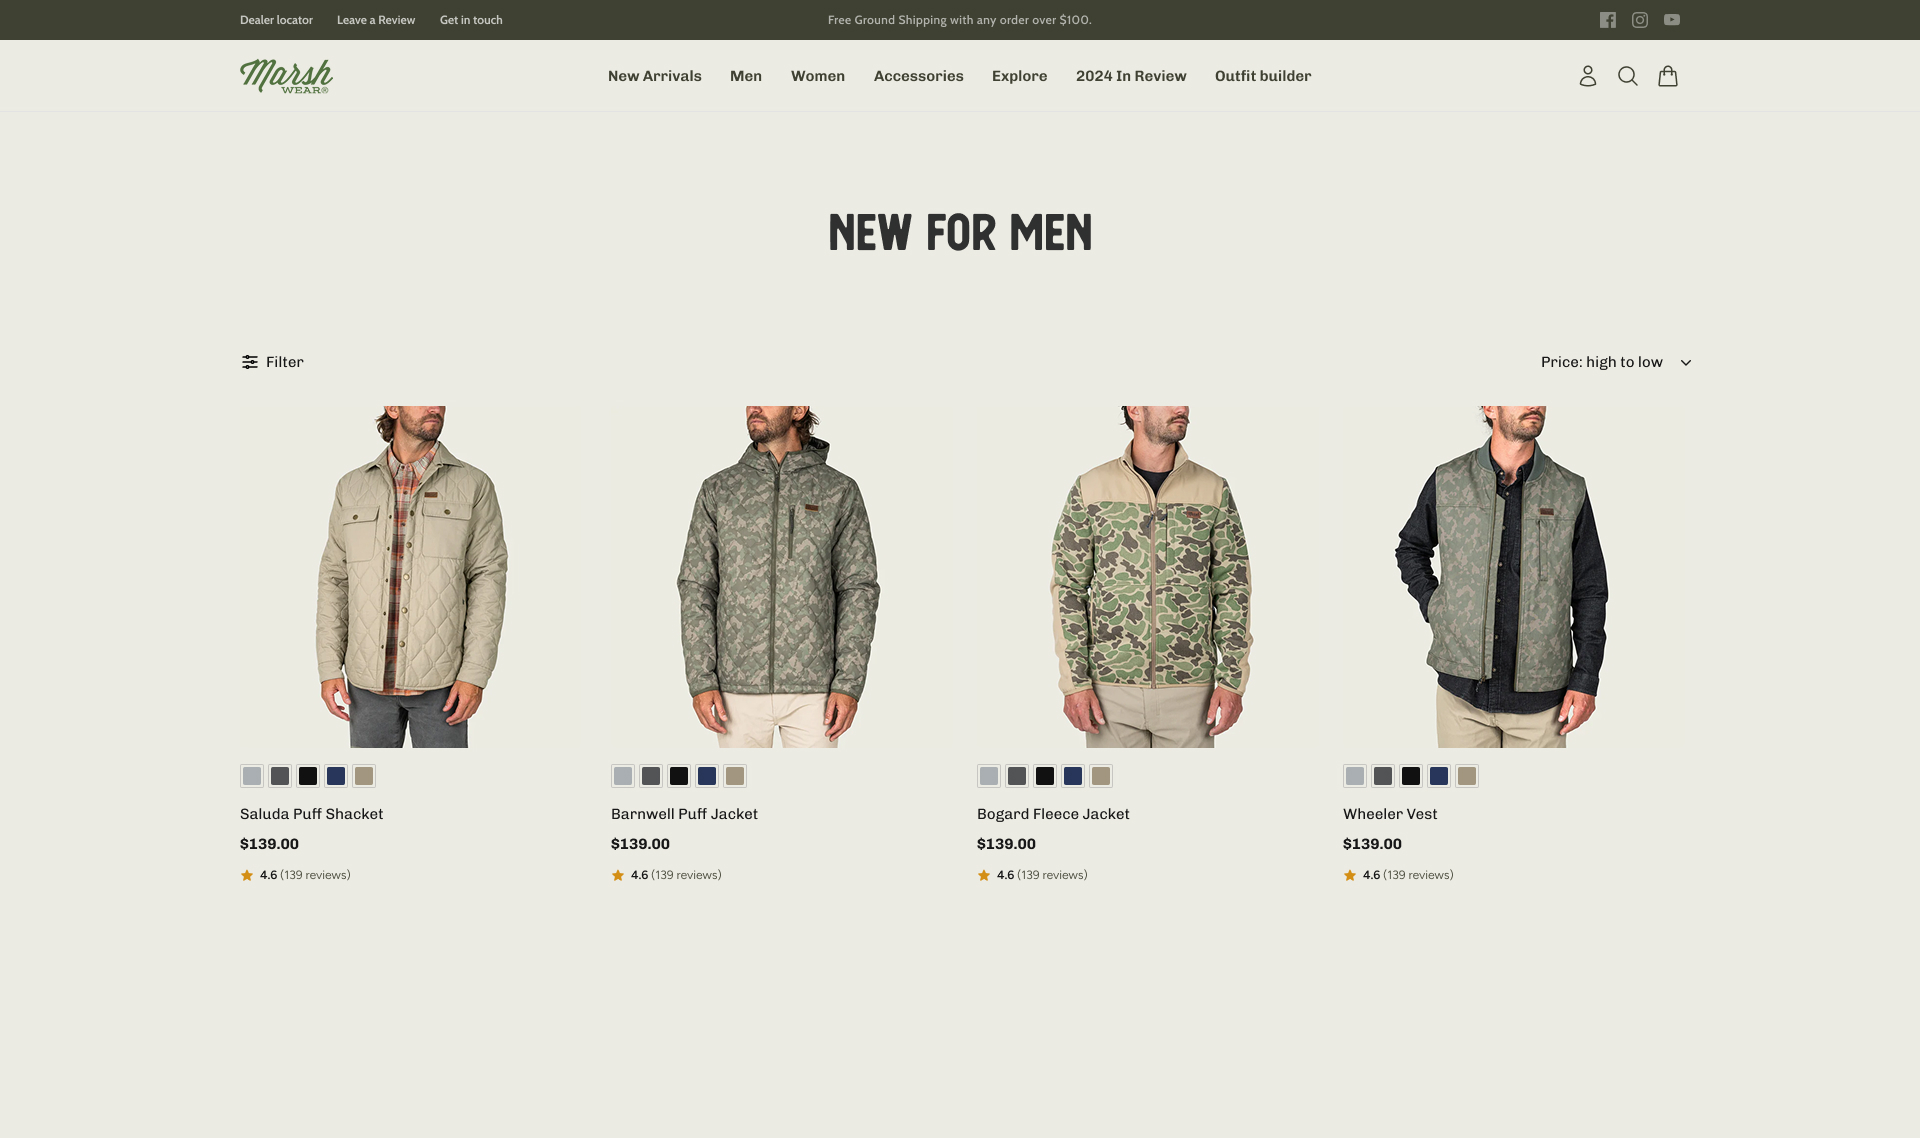
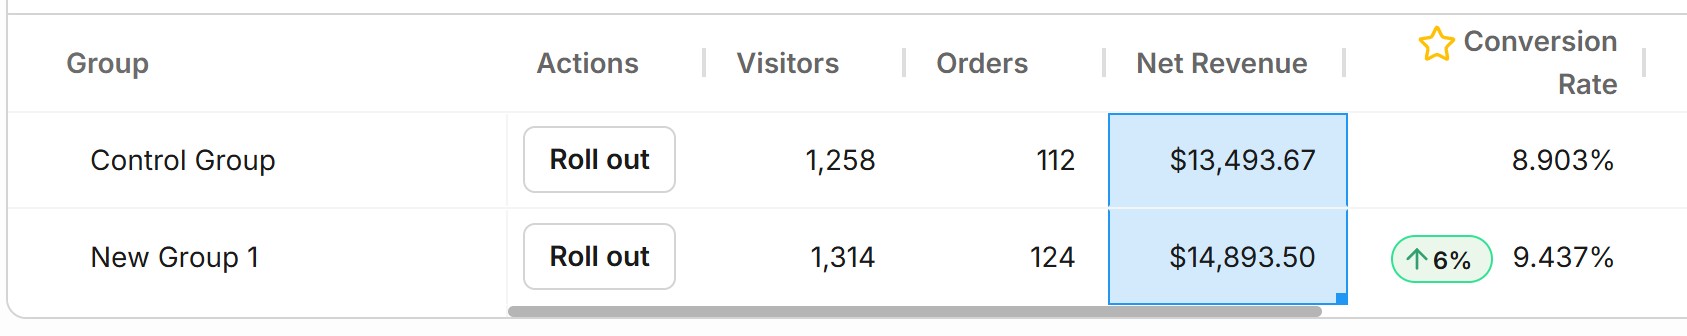
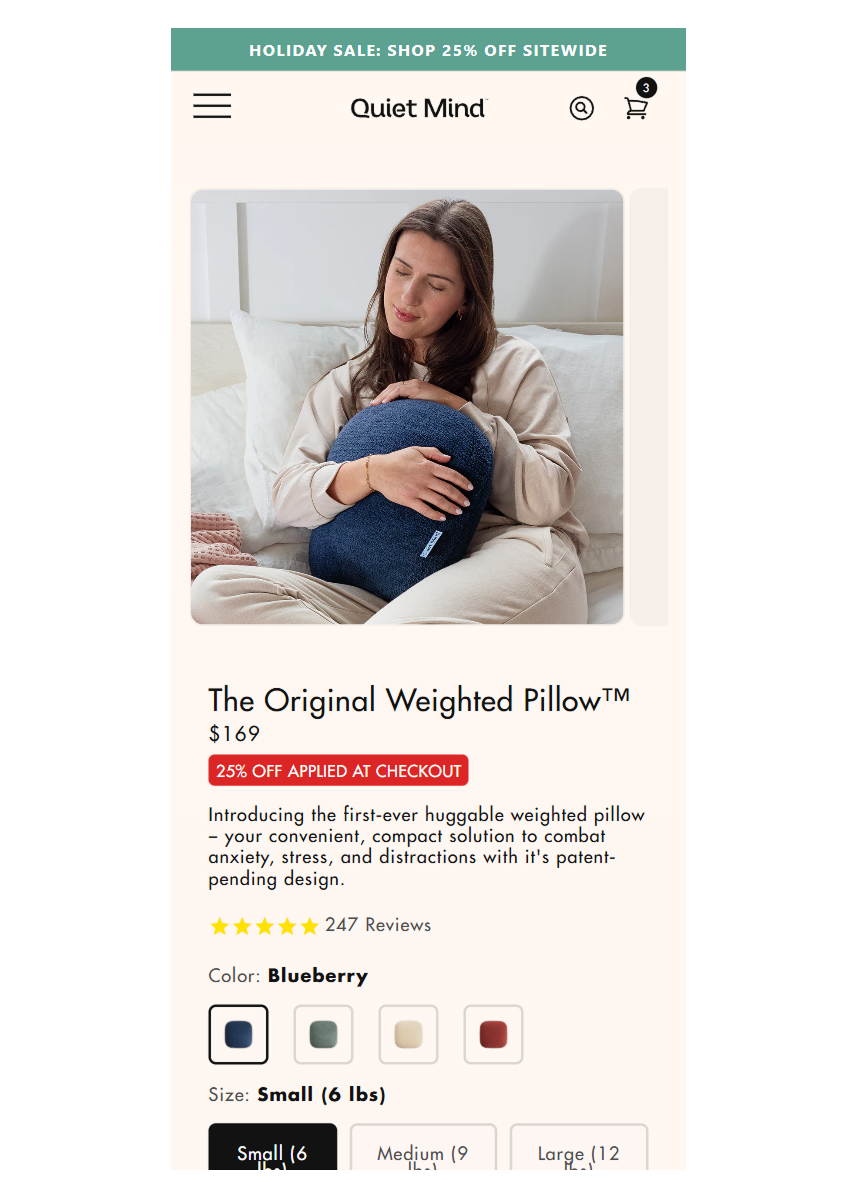
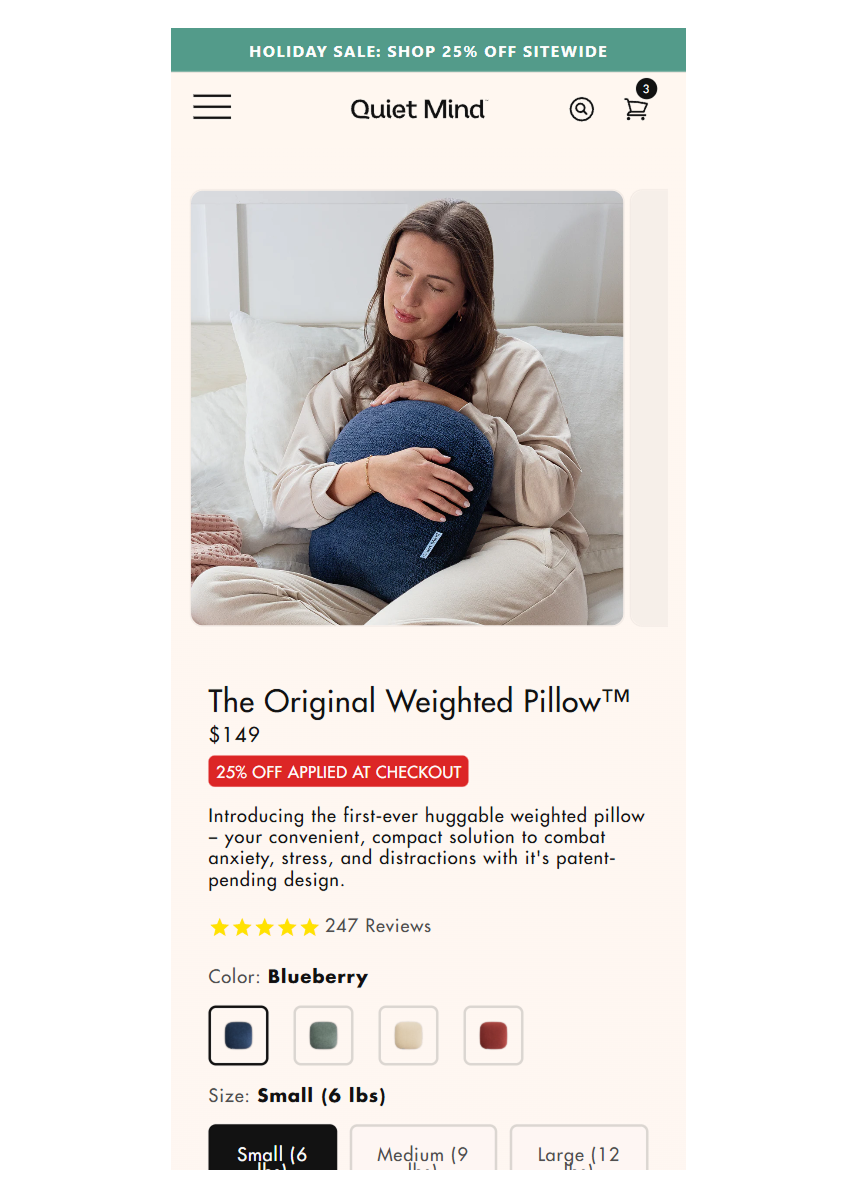
Tested a 15% price increase on three flagship weighted pillow SKUs. Conversion rate went up, not down. The original price was anchoring the product as "cheap," and the target audience associated higher price with higher quality.


For TooTimid: Your premium vibrators and toys could be underpriced relative to what your customers expect to pay for quality. A price test on your top 3-5 SKUs would tell us immediately whether you're leaving margin on the table.
Tested raising the free shipping threshold from $79 to $99. Pushed customers to add one more item to qualify. Average overshoot was 25-30% above the new threshold.


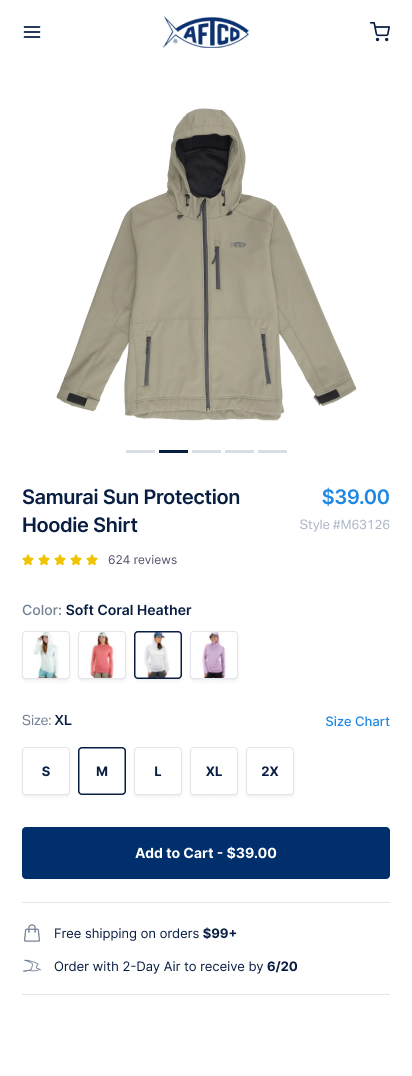
For TooTimid: Your current free shipping threshold is $59. Testing a higher threshold ($79 or $99) could meaningfully lift AOV. Your catalogue is deep enough that customers can easily add complementary items to reach a higher bar.
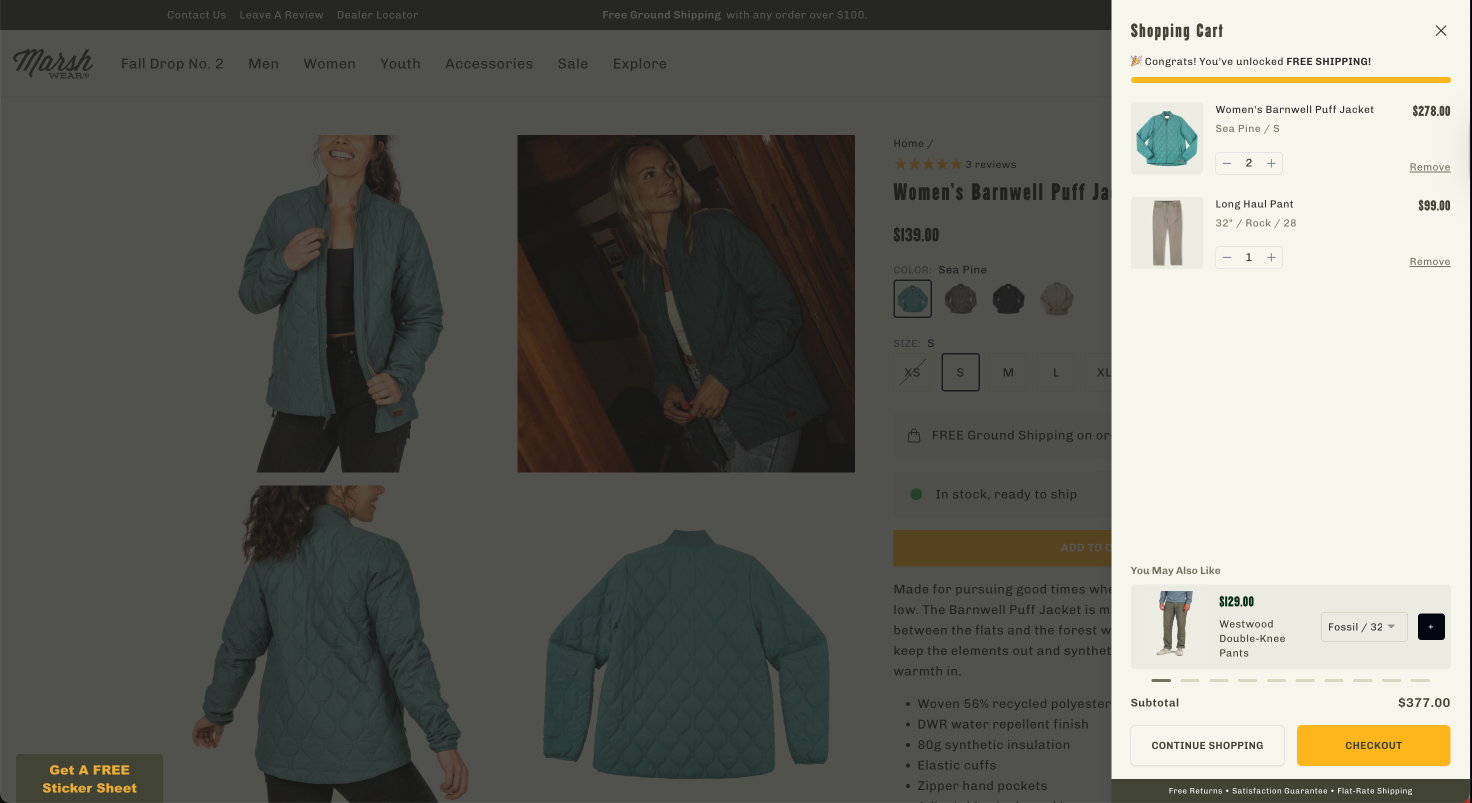
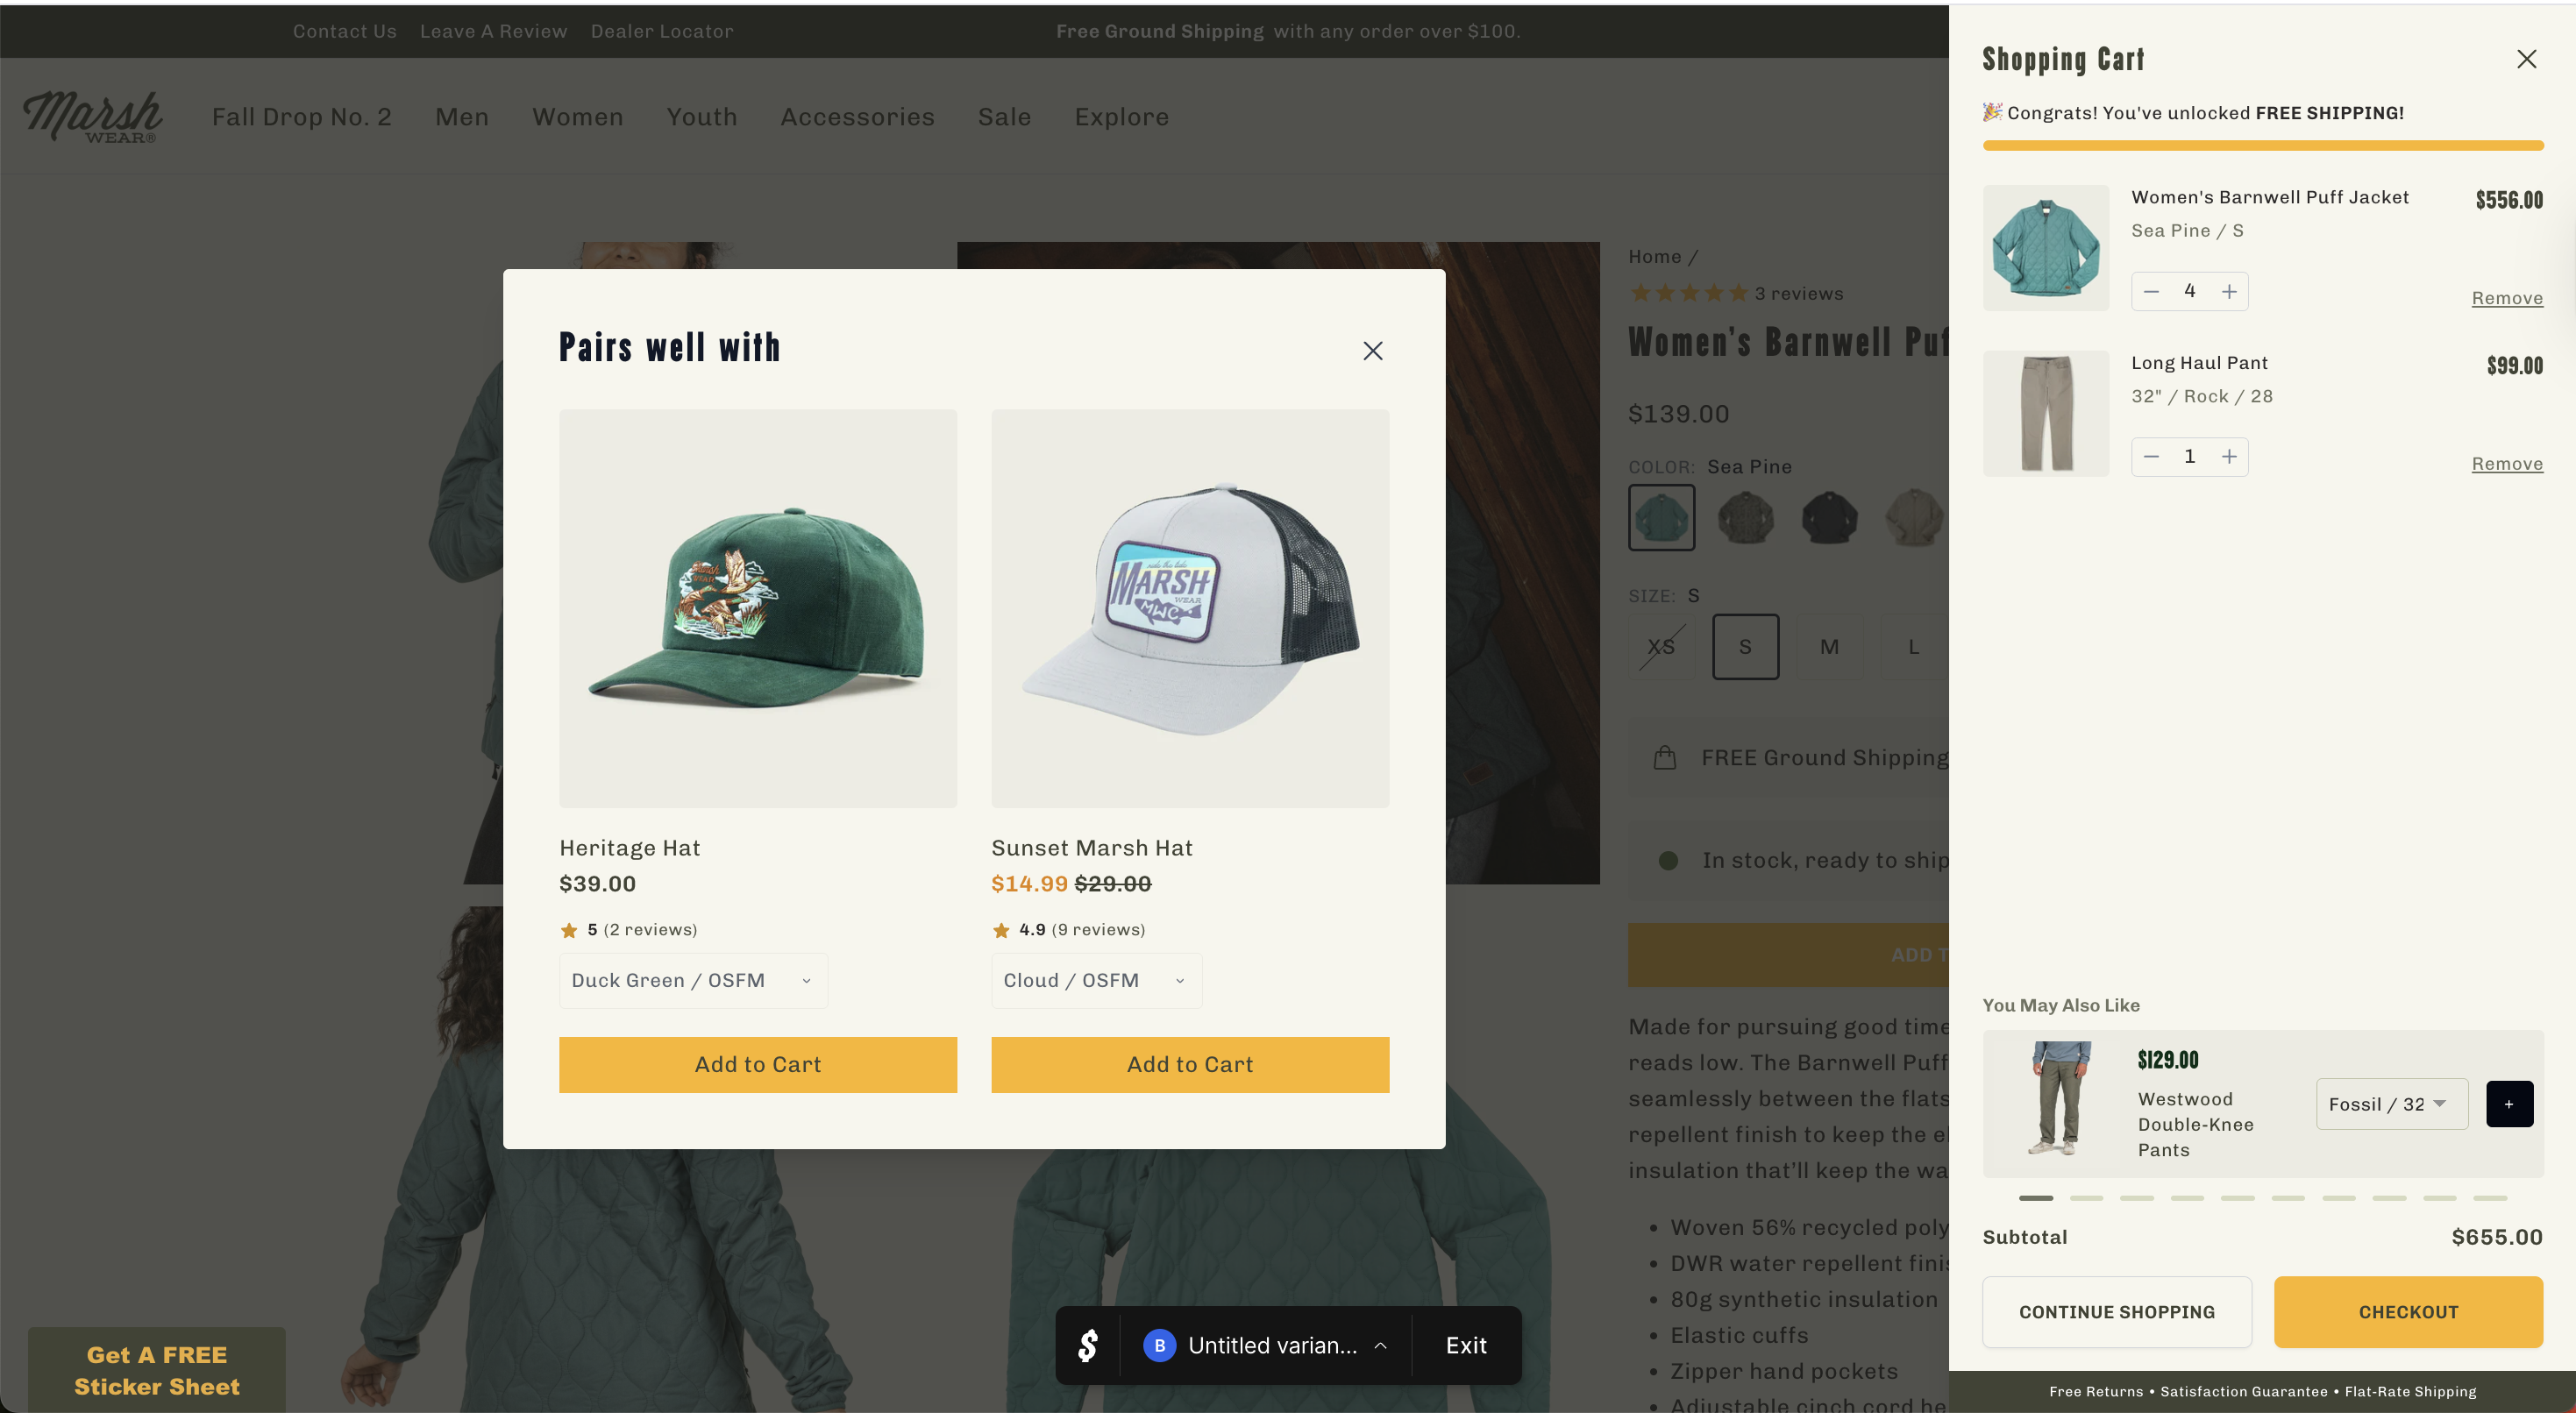
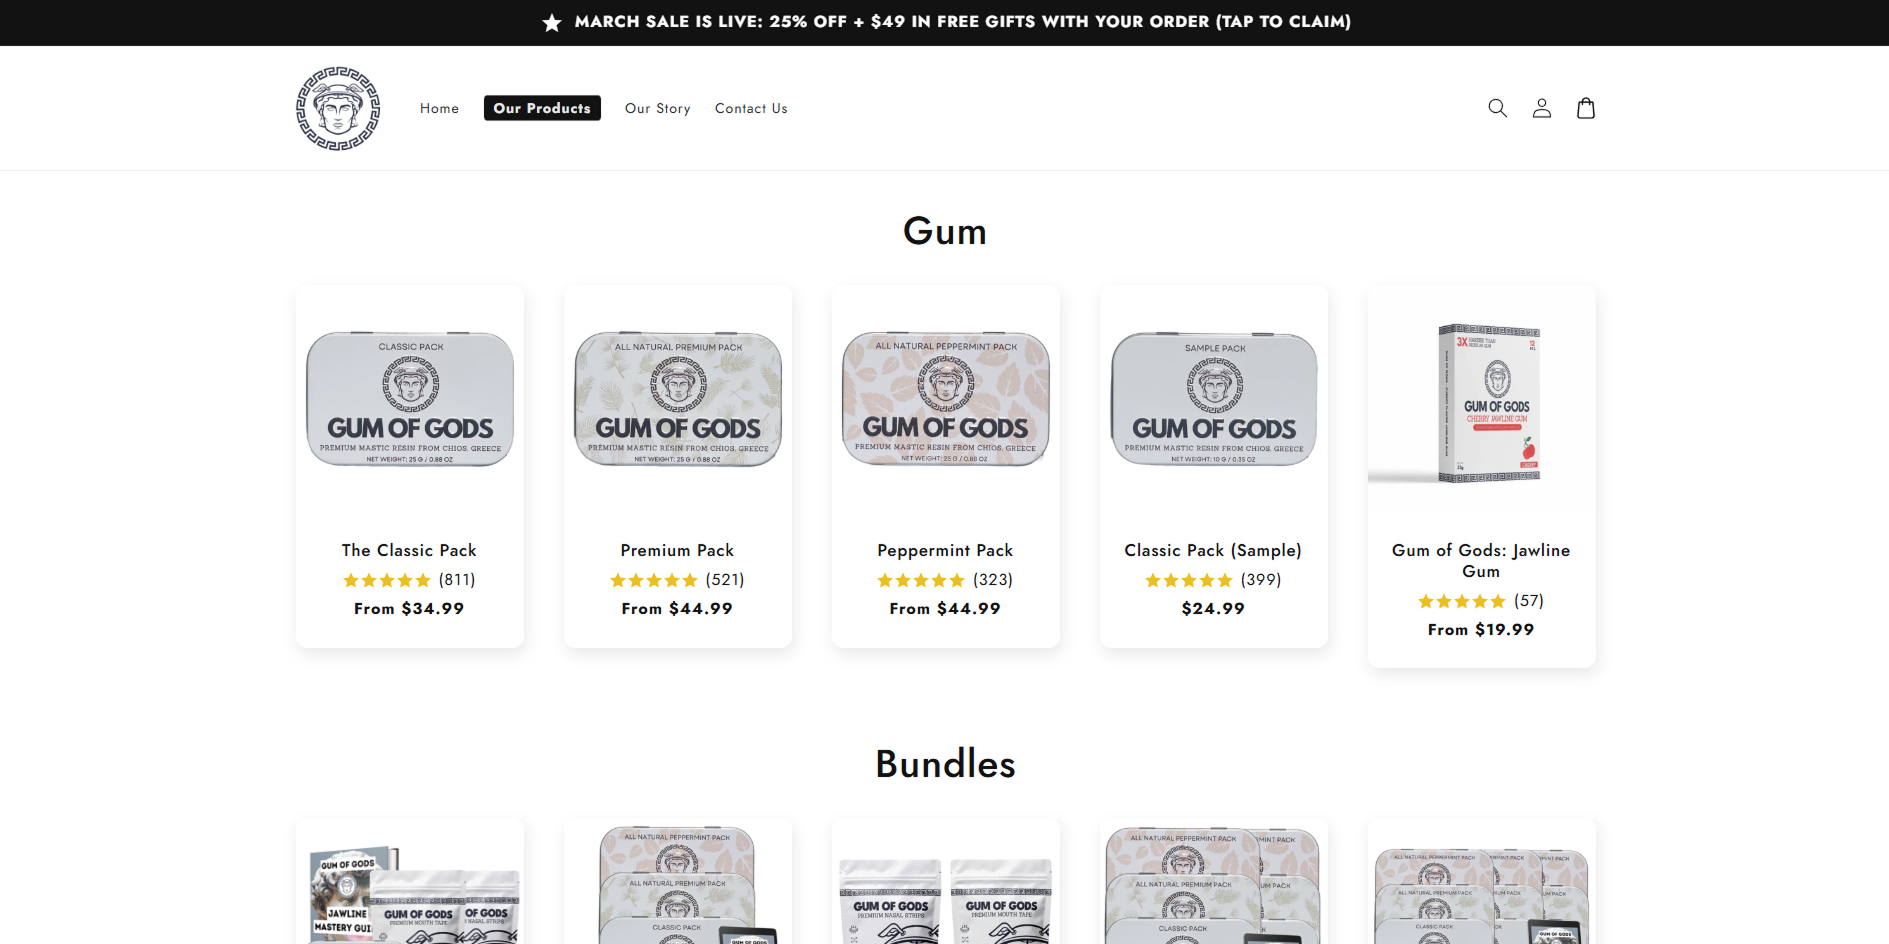
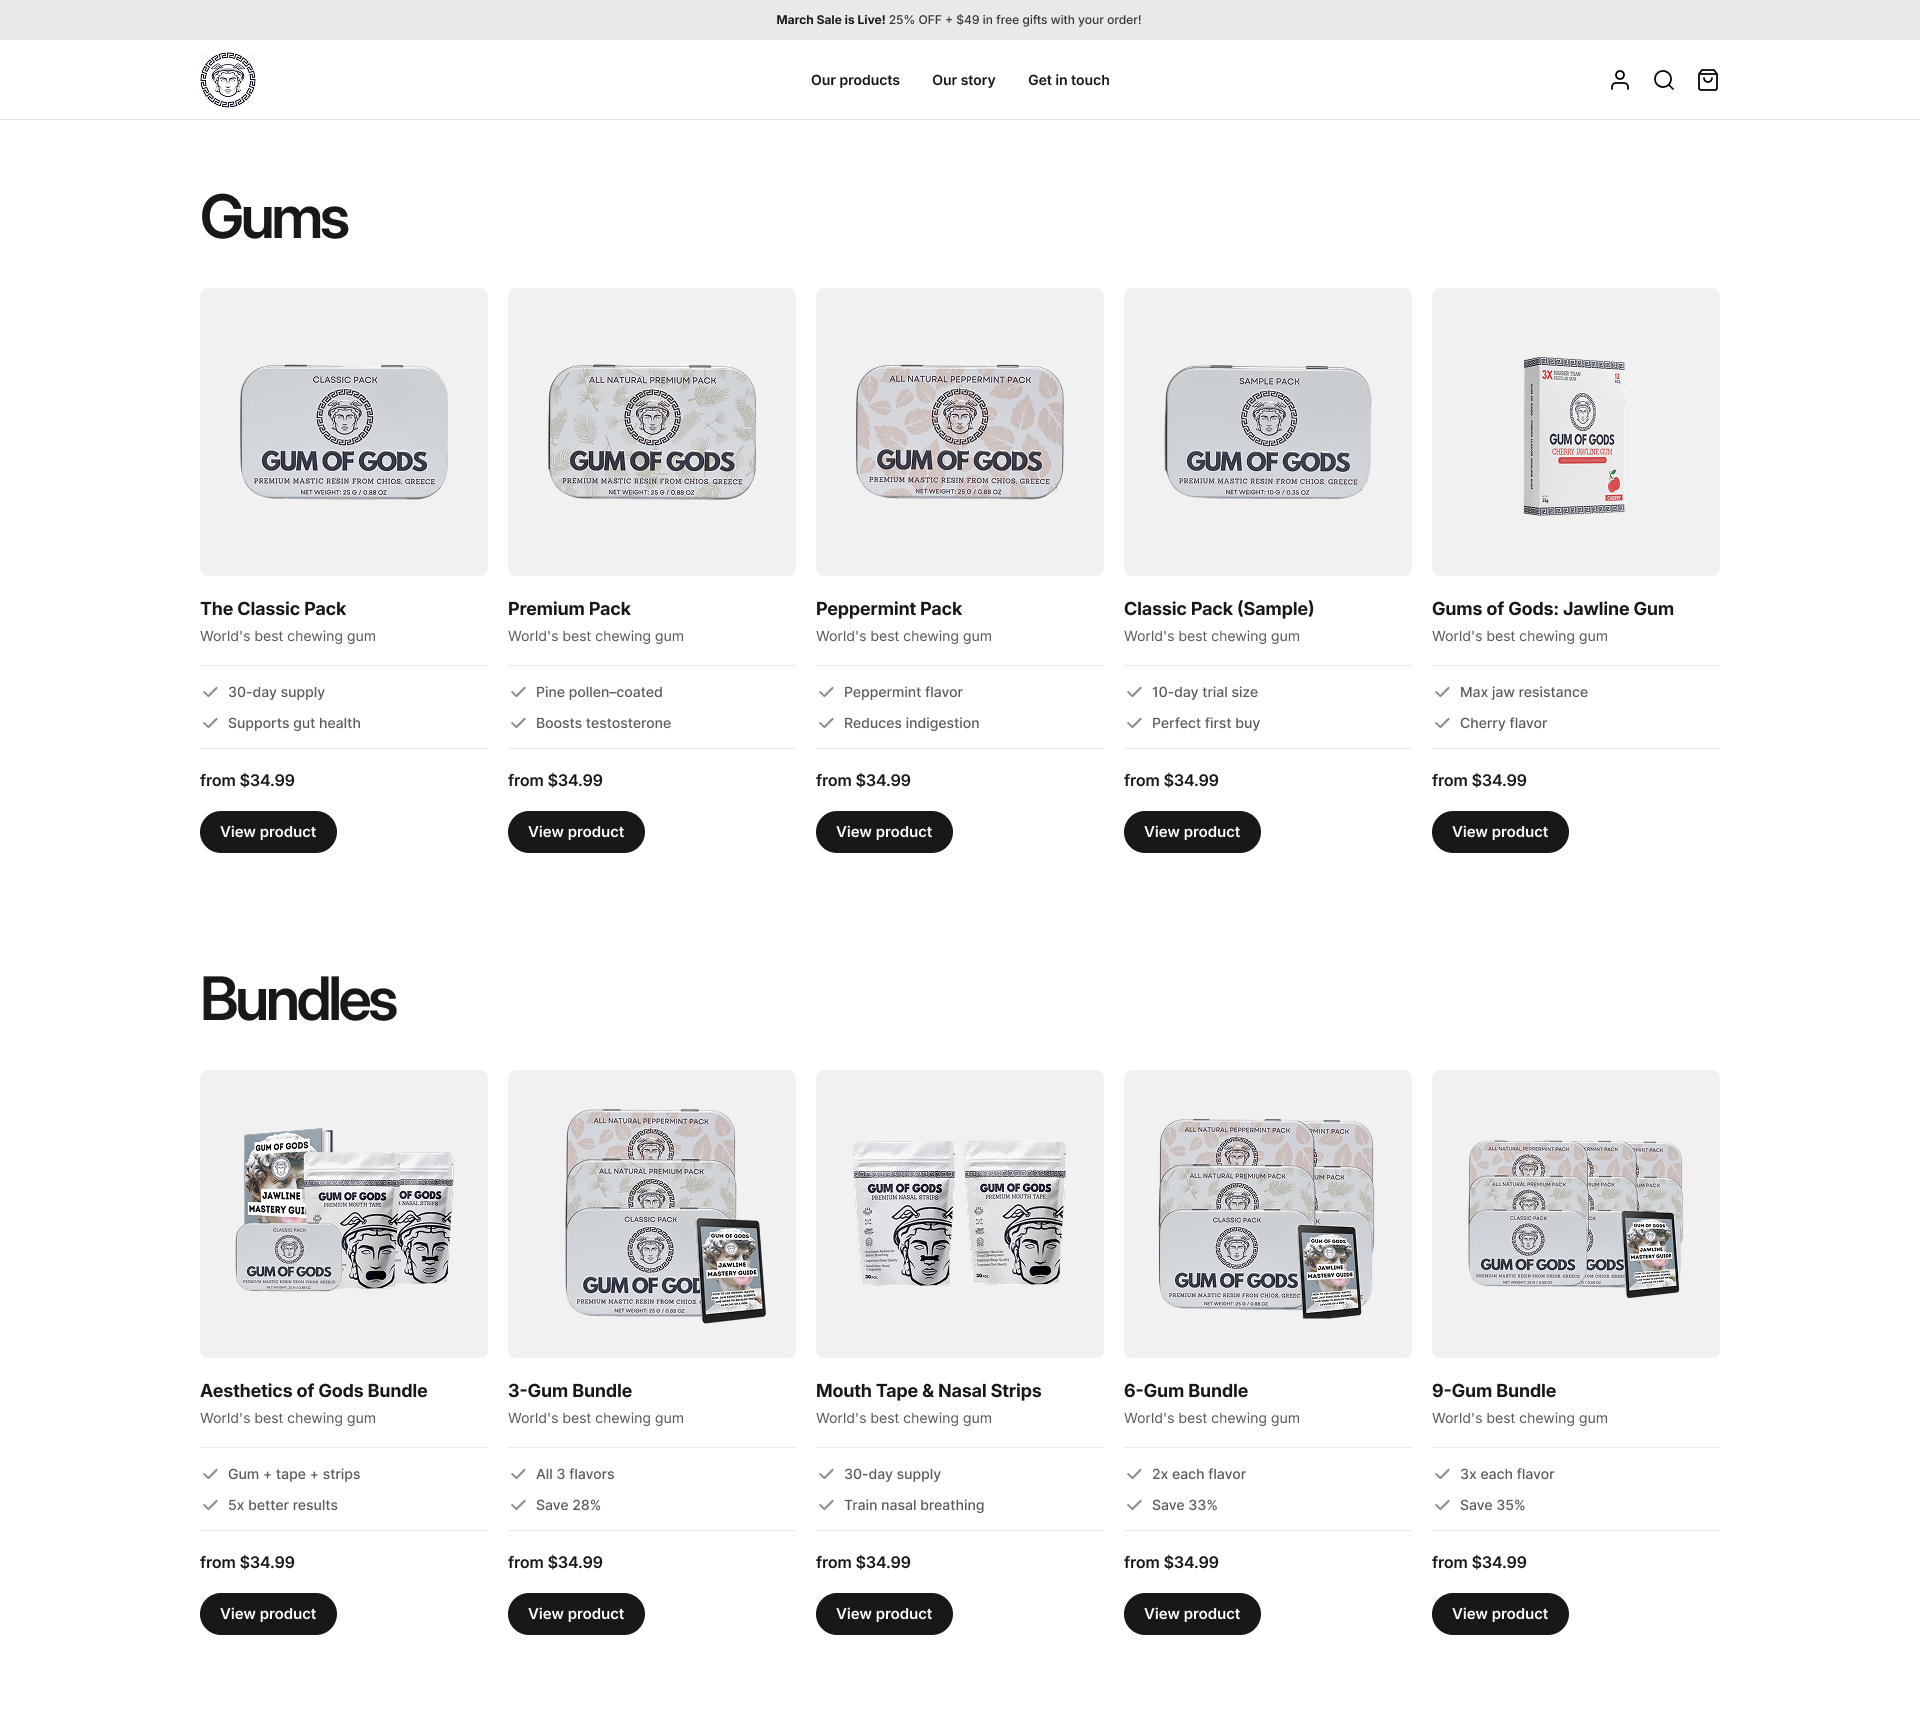
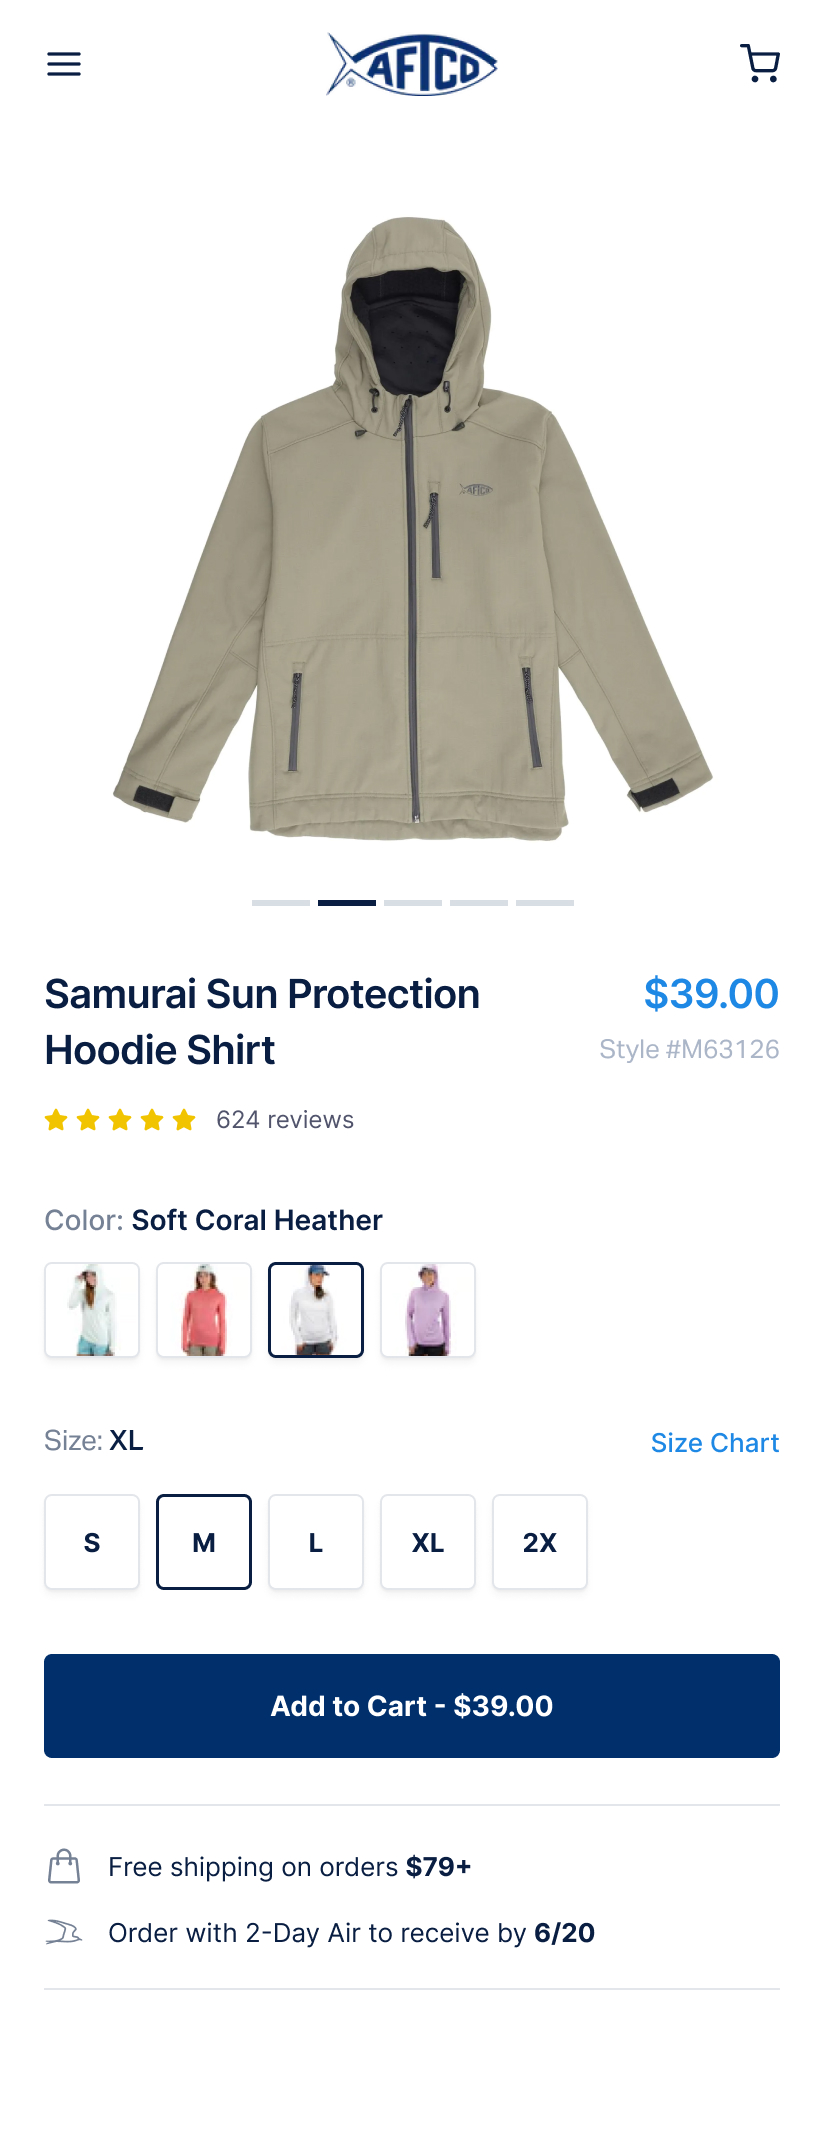
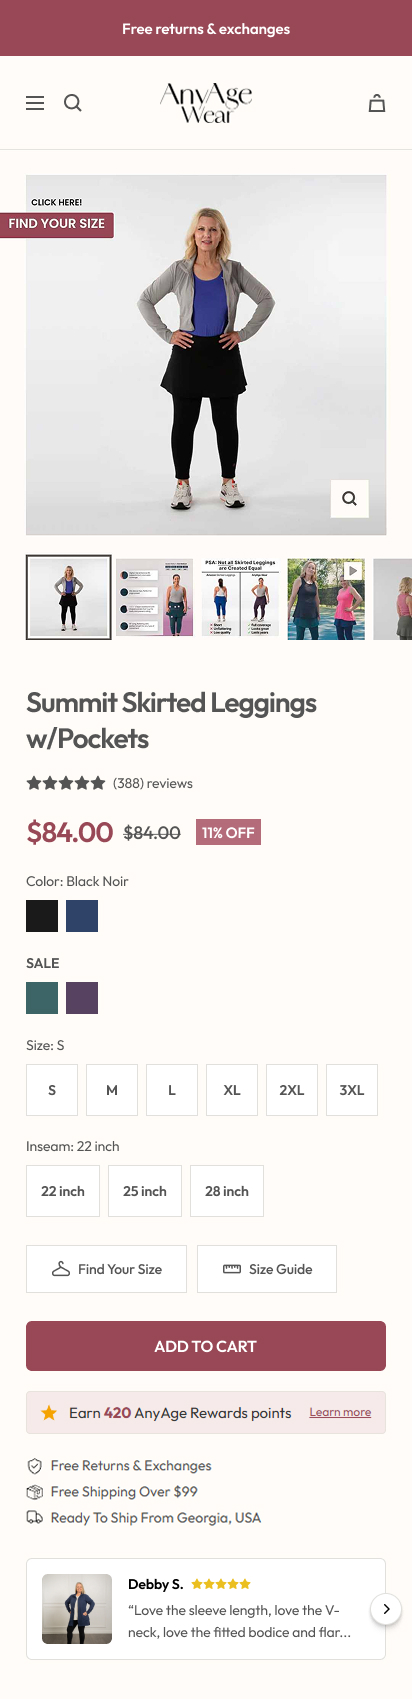
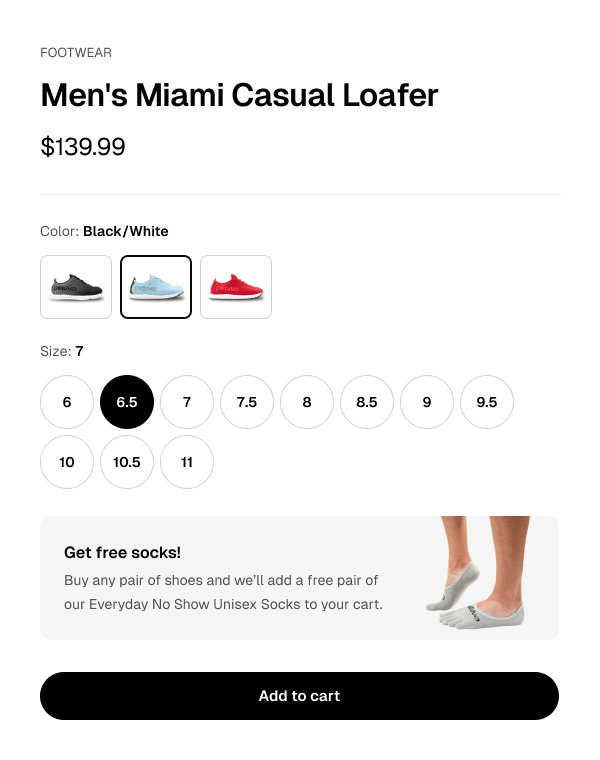
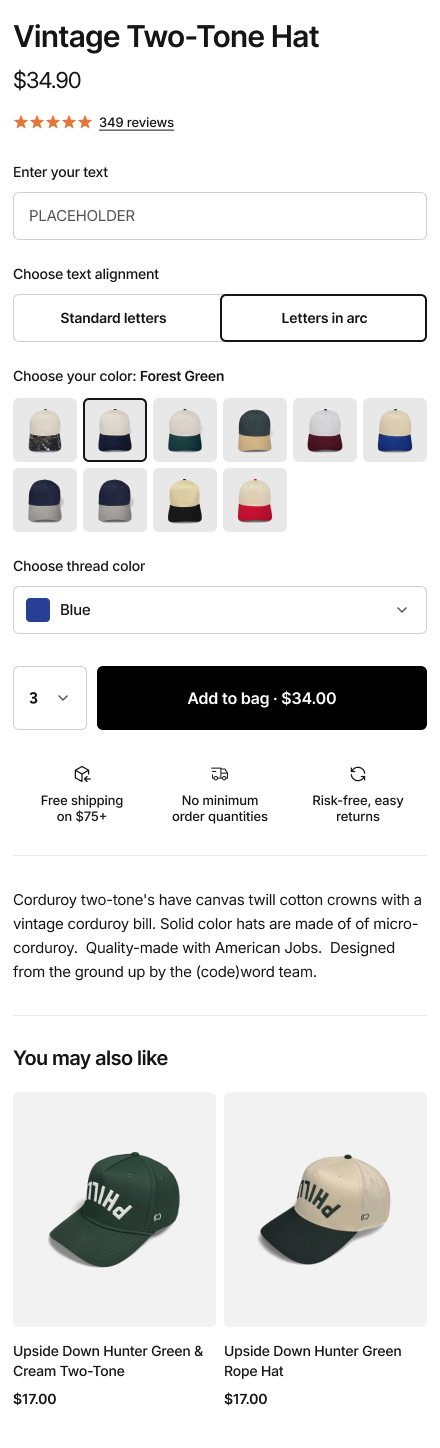
Introduced a "Complete Kit" bundle on the PDP — the hero product plus matching accessories at a combined price 12% below buying separately. Positioned as the default recommended option, not an afterthought in a sidebar widget.


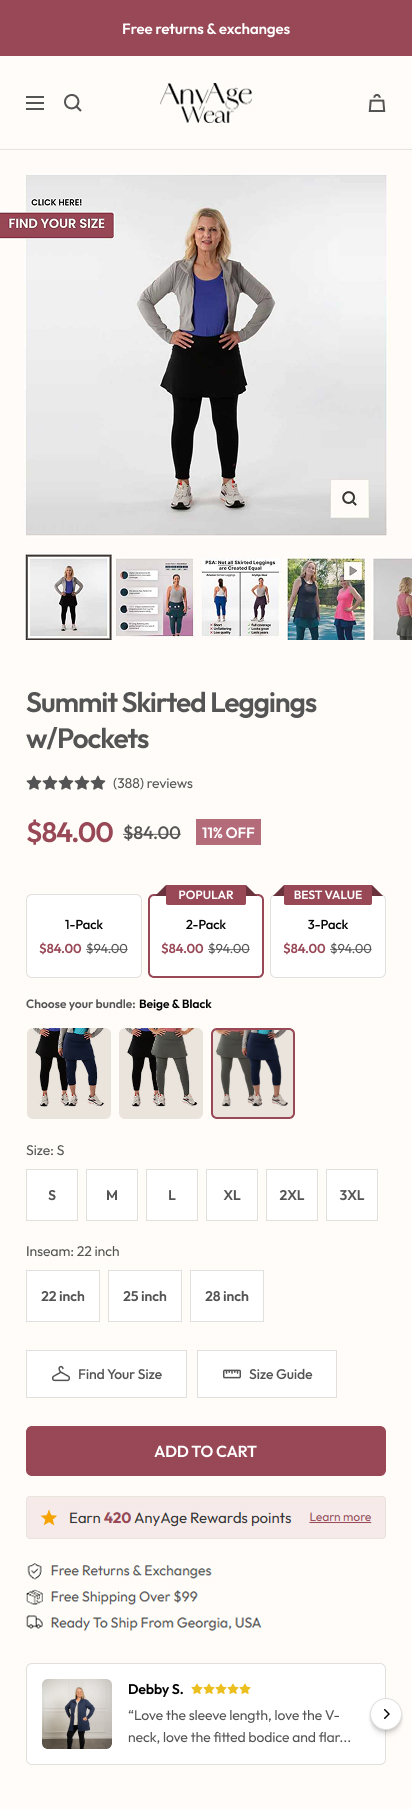
For TooTimid: Couples kits, first-timer starter kits, or "date night" bundles would map directly to your two largest customer segments — couples (35%) and first-time explorers (25%). Bundles reduce decision paralysis and increase AOV in a single move.
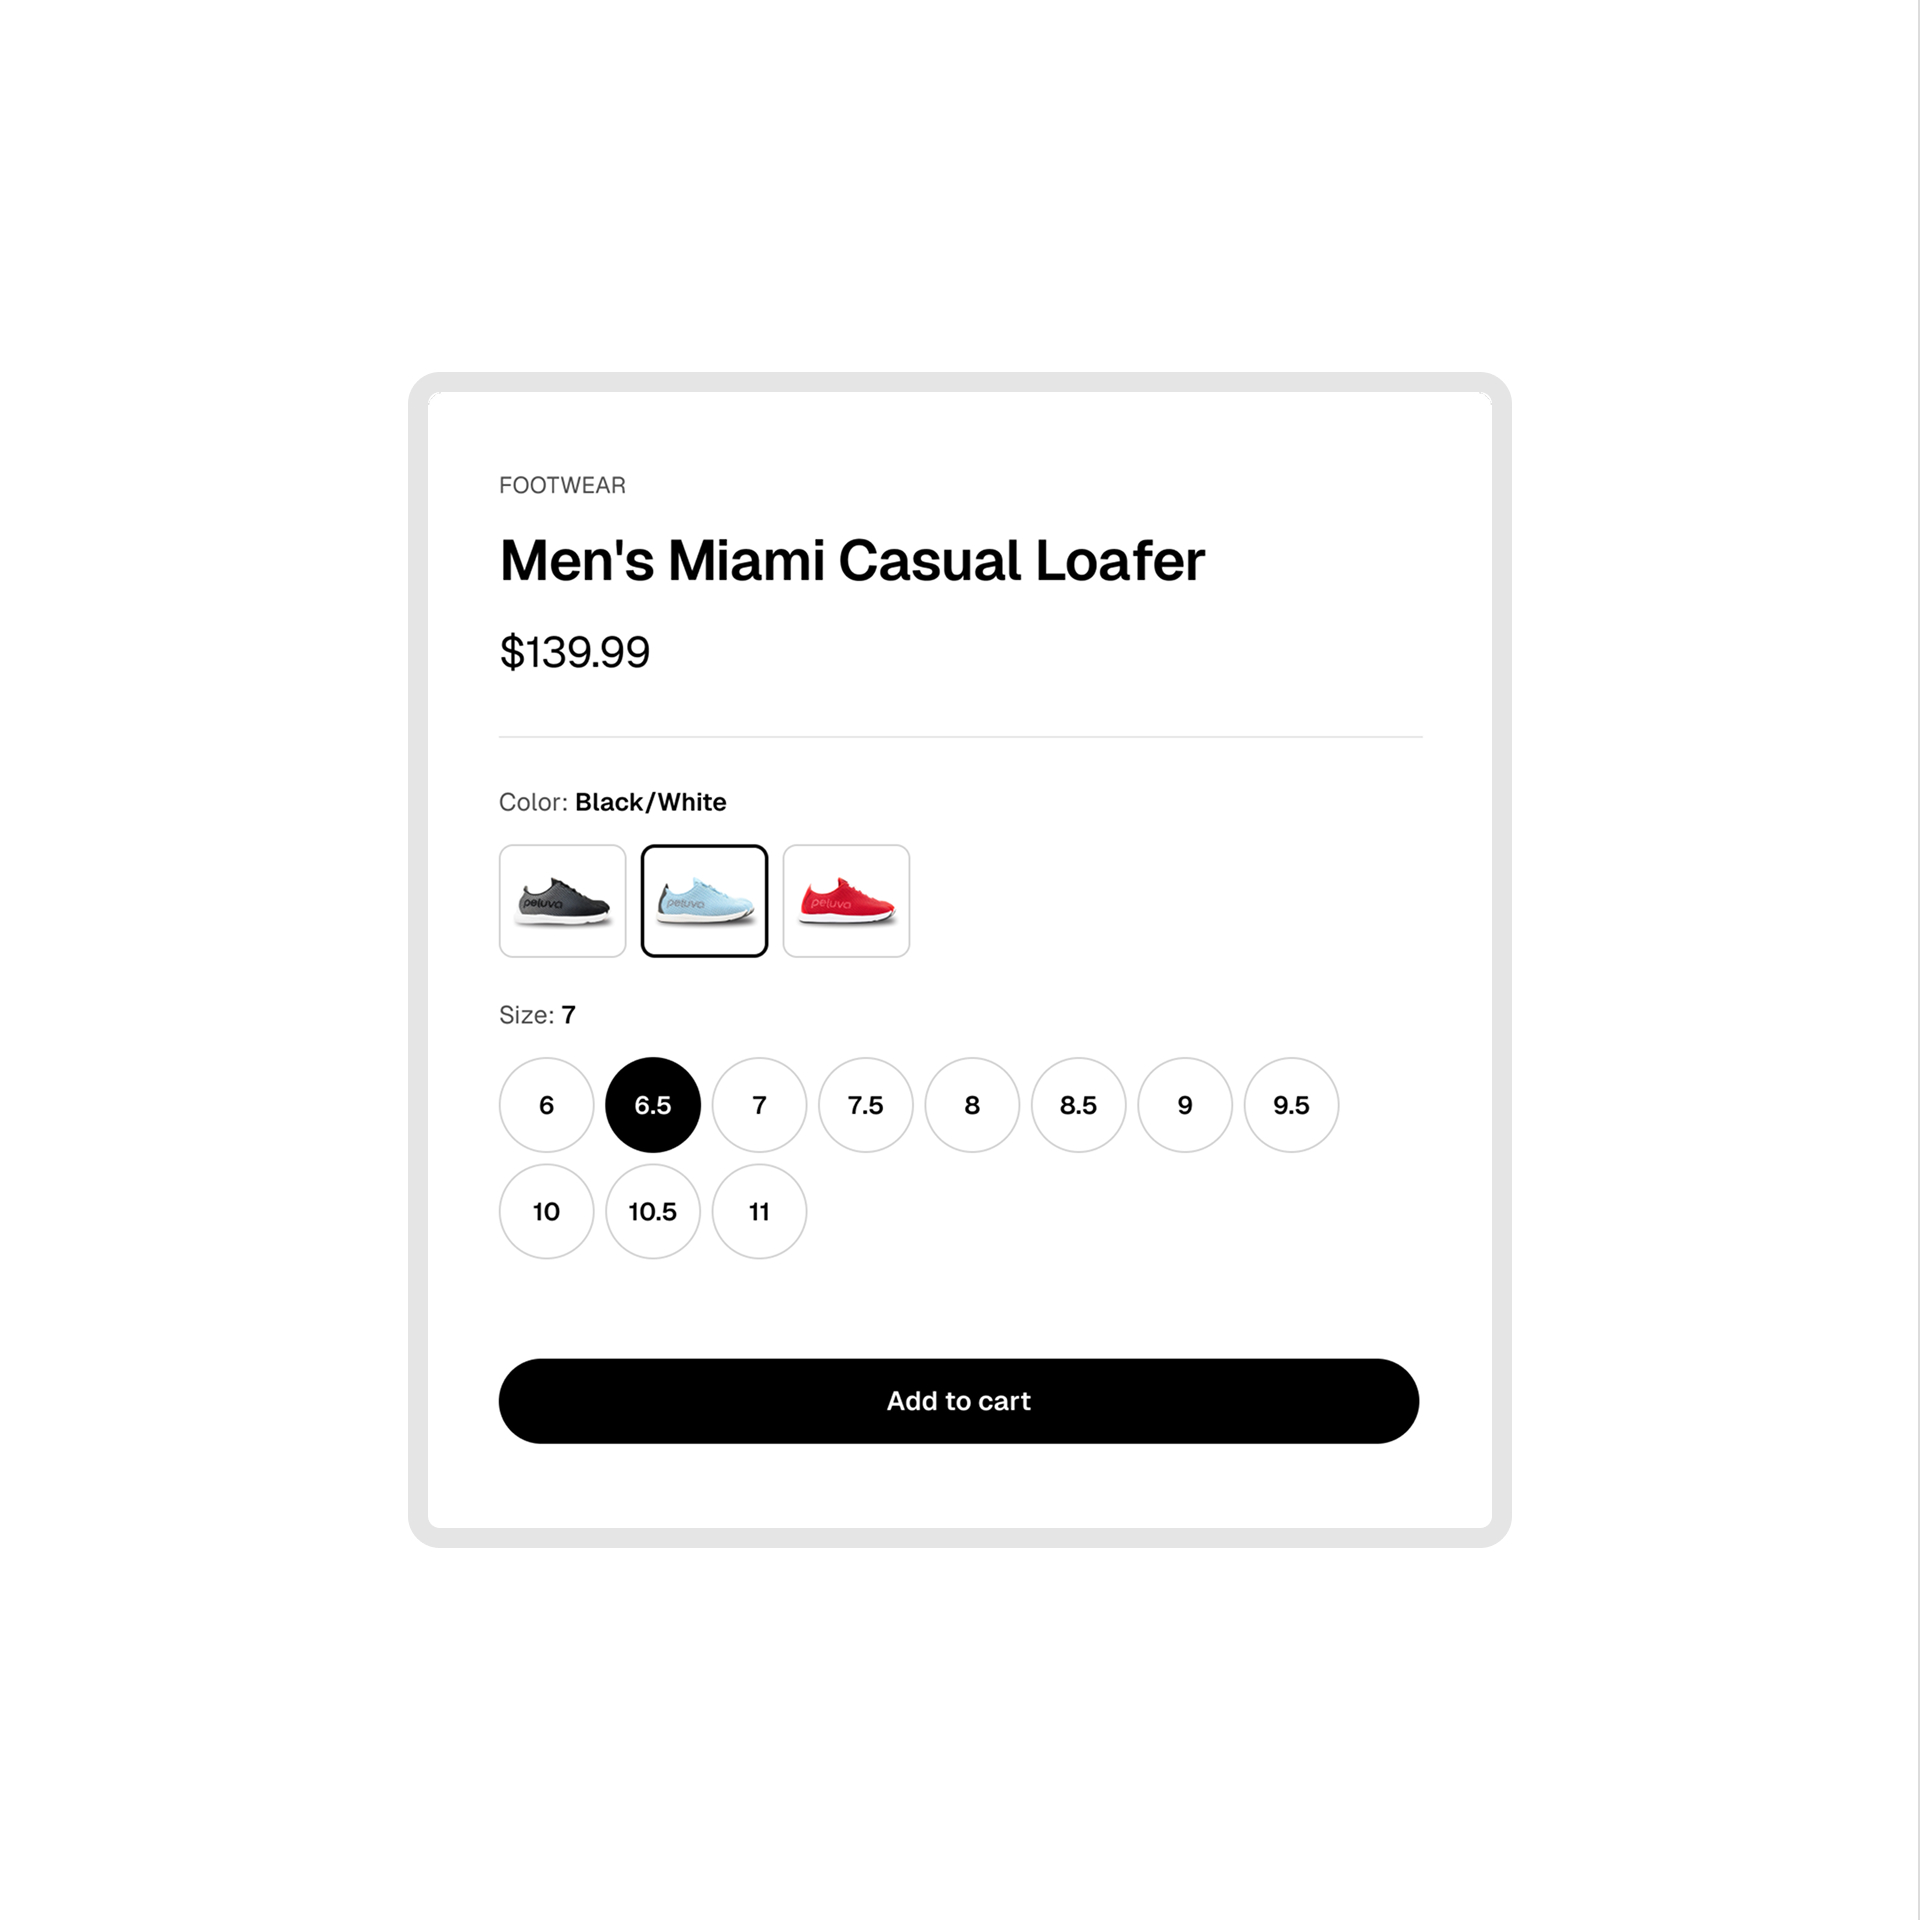
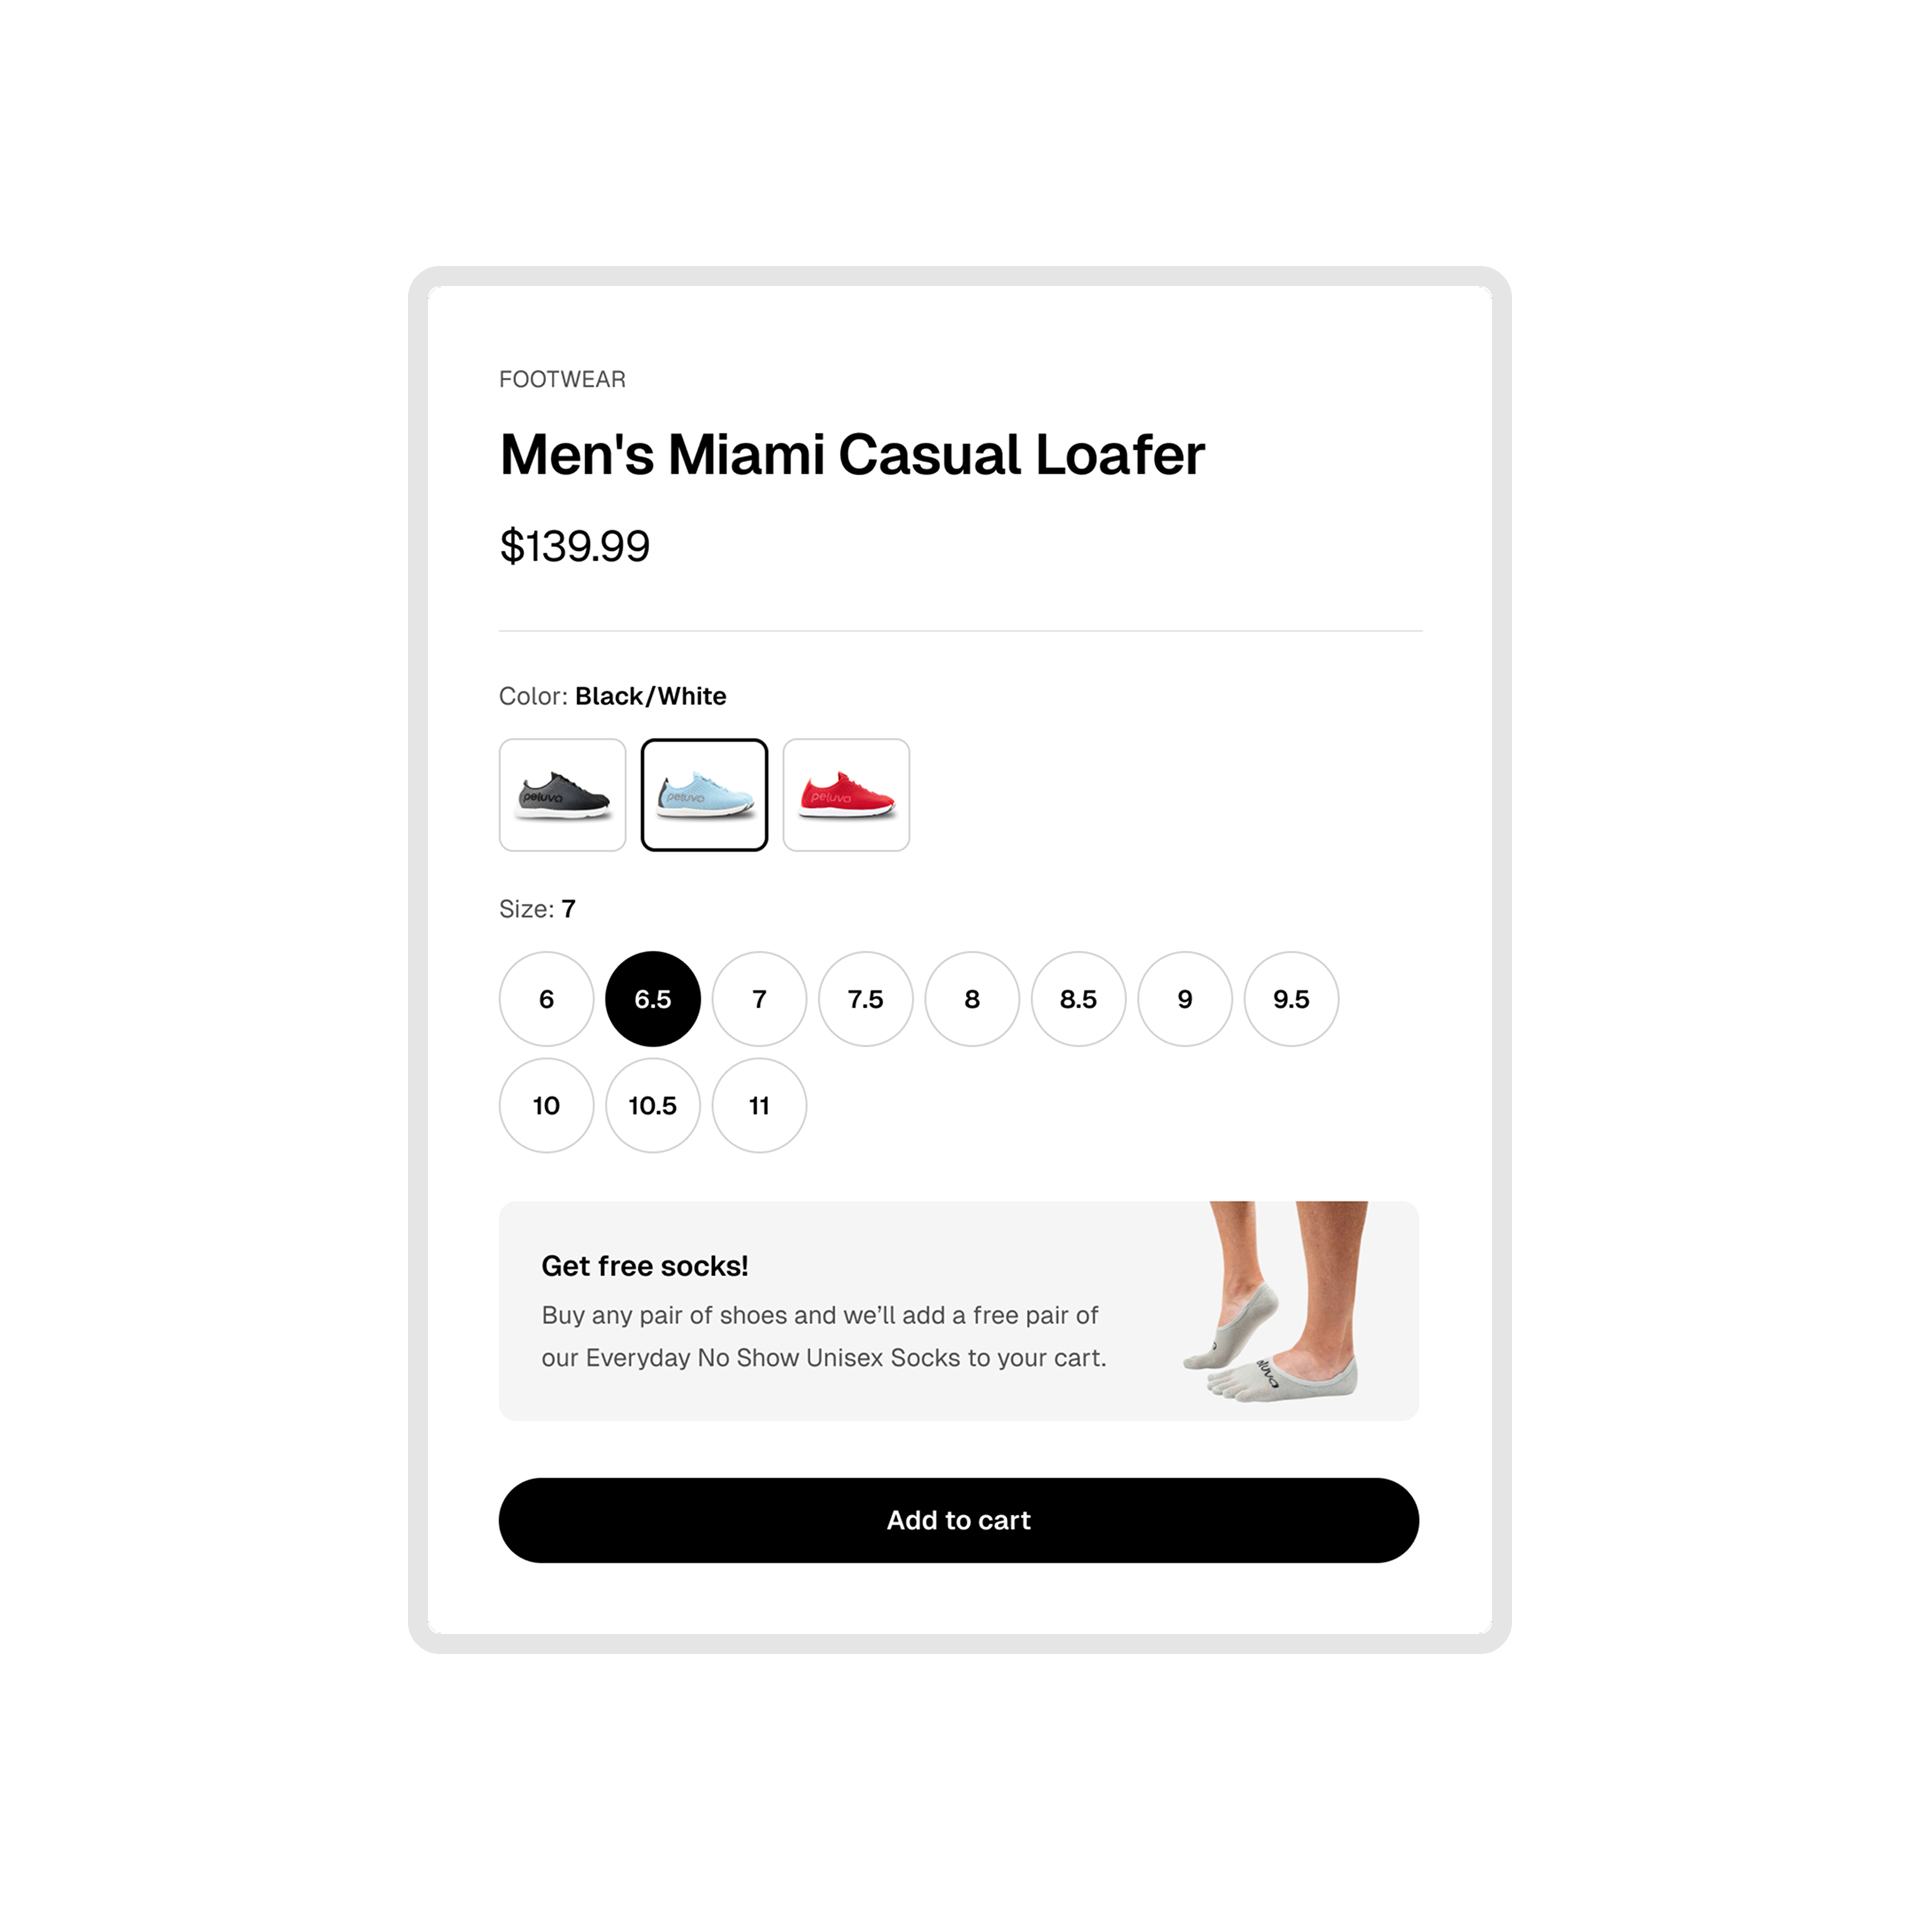
Replaced a sitewide 15% discount code with a free branded accessory (retail value $25) on orders over $75. The gift with purchase outperformed the discount across every metric — conversion, AOV, and margin.


For TooTimid: You already include a free gift with every order, but you're also running a permanent 50% sitewide discount code. Testing whether the free gift alone drives comparable results could recover significant margin.
Added a subscribe & save option on the PDP for consumable products — 10% discount on recurring orders with a toggle between one-time and subscription. Subscription set as the default selection.
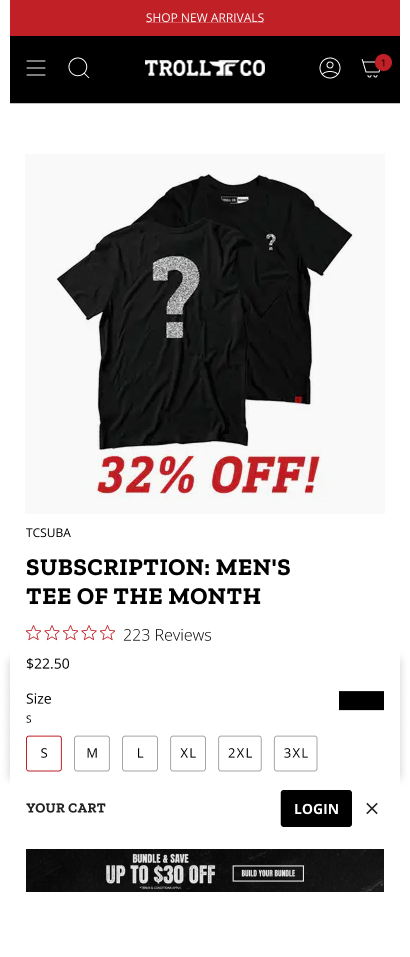

For TooTimid: Lubricants, toy cleaners, and other consumables are natural candidates for subscription. These products run out and need replenishing — a subscribe & save model generates predictable recurring revenue at zero acquisition cost.
Removed the permanent discount code from the hero product and tested it at full price with stronger value messaging. Checkout completions actually increased because removing the discount code field eliminated the "let me go find a code" abandonment loop.


For TooTimid: You're running a permanent "SEXY50" code for 50% off sitewide. Testing what happens when the discount disappears — replaced with value messaging and the free gift offer — could be one of the single highest-impact changes on your store.
Replaced a flat 10% discount with tiered spend-and-save thresholds: spend $100 save 10%, spend $150 save 15%, spend $200 save 20%. Most customers aimed for the middle tier, overshooting their original cart value by 25-40%.


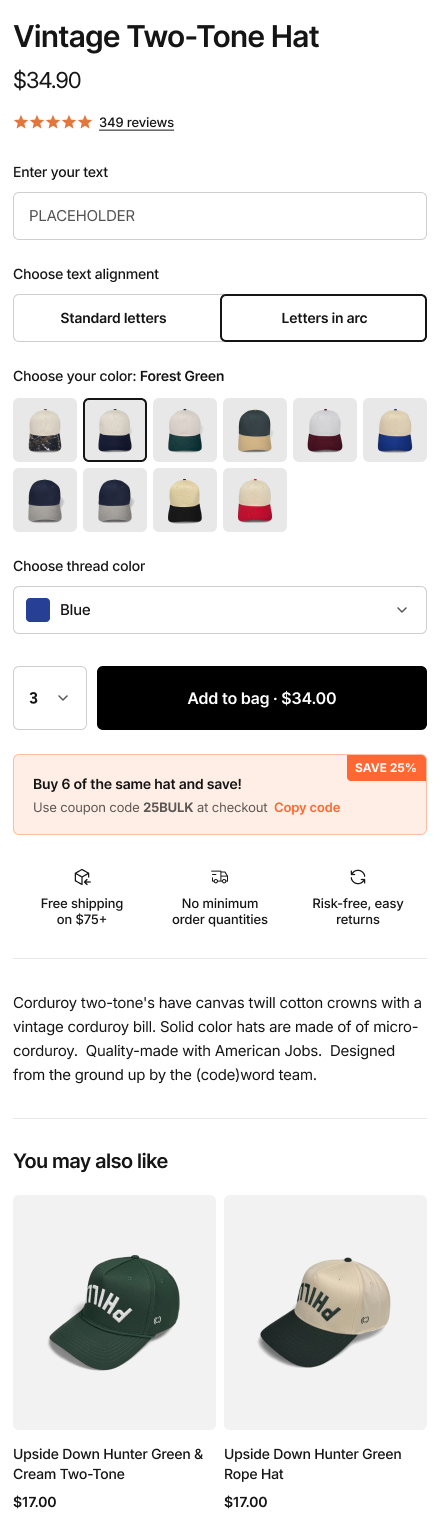
For TooTimid: Tiered spend-and-save could replace the blanket 50% code. It gives customers a reason to add more items while maintaining healthier margins at every tier.
Added a one-click upsell page between checkout completion and the thank-you page. Offered complementary products with a "Buy 1 Get 1 40% Off" incentive, purchasable with a single tap — no re-entering payment details. 18% of customers took the offer.


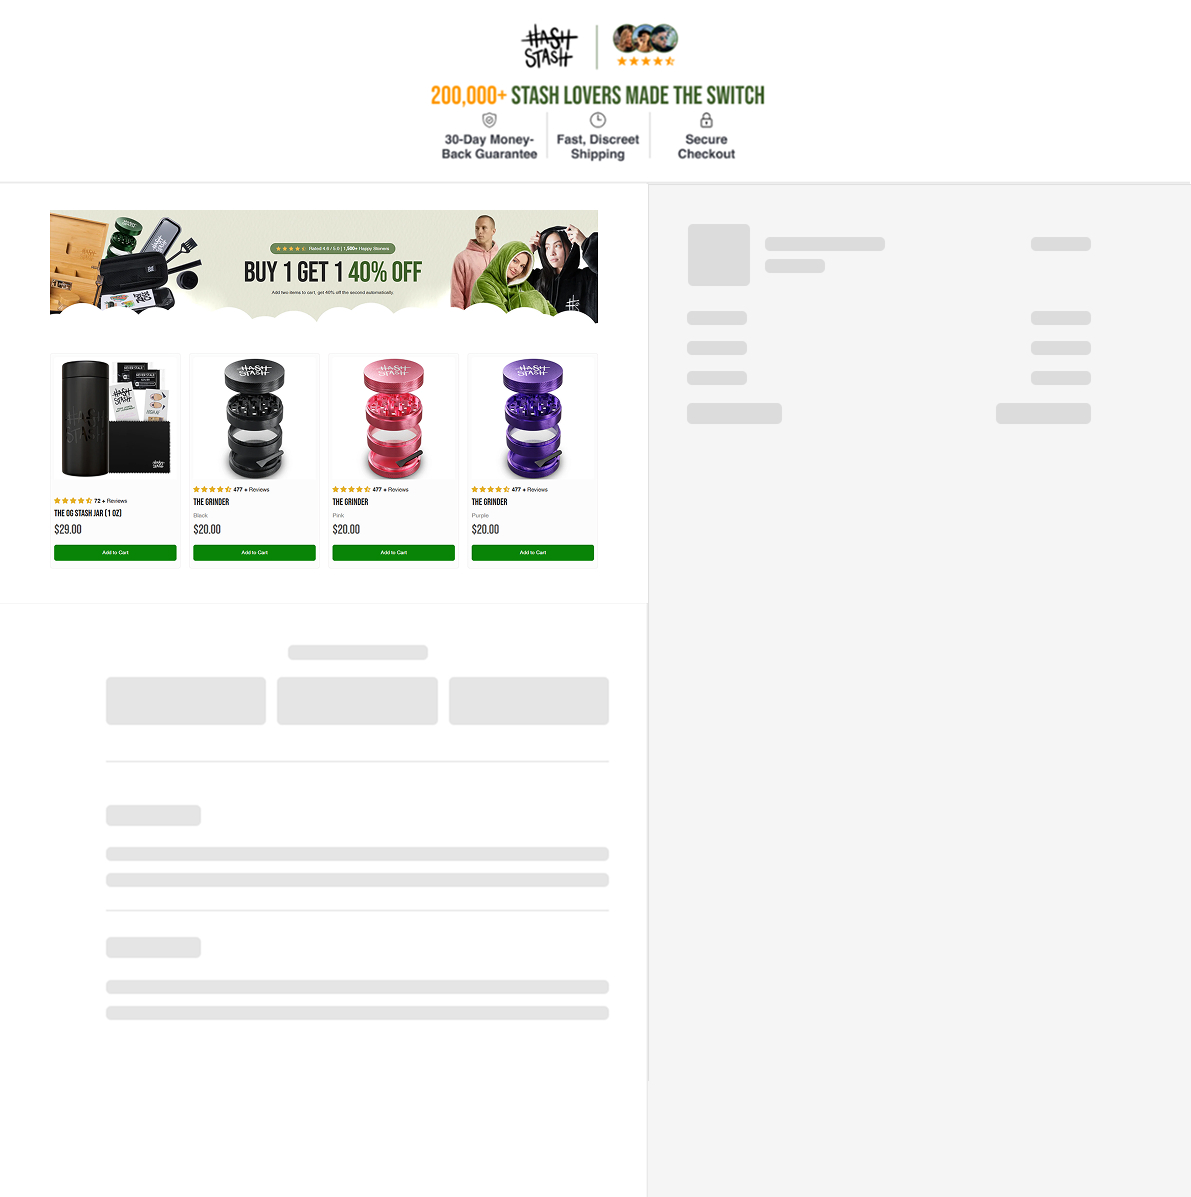
For TooTimid: Post-purchase upsells are especially powerful in your category because the customer has already committed — they've overcome the privacy anxiety and entered payment details. Adding a complementary item at that point is frictionless. We're not sure if you're currently running post-purchase upsells, but this is something we'd like to experiment with — trying different combinations of products and offers.
Created a $49 "First Timer Kit" — a curated selection of entry-level products bundled at a slight discount. Targeted at new visitors from paid ads. Reduced decision paralysis for first-time buyers who didn't know where to start.


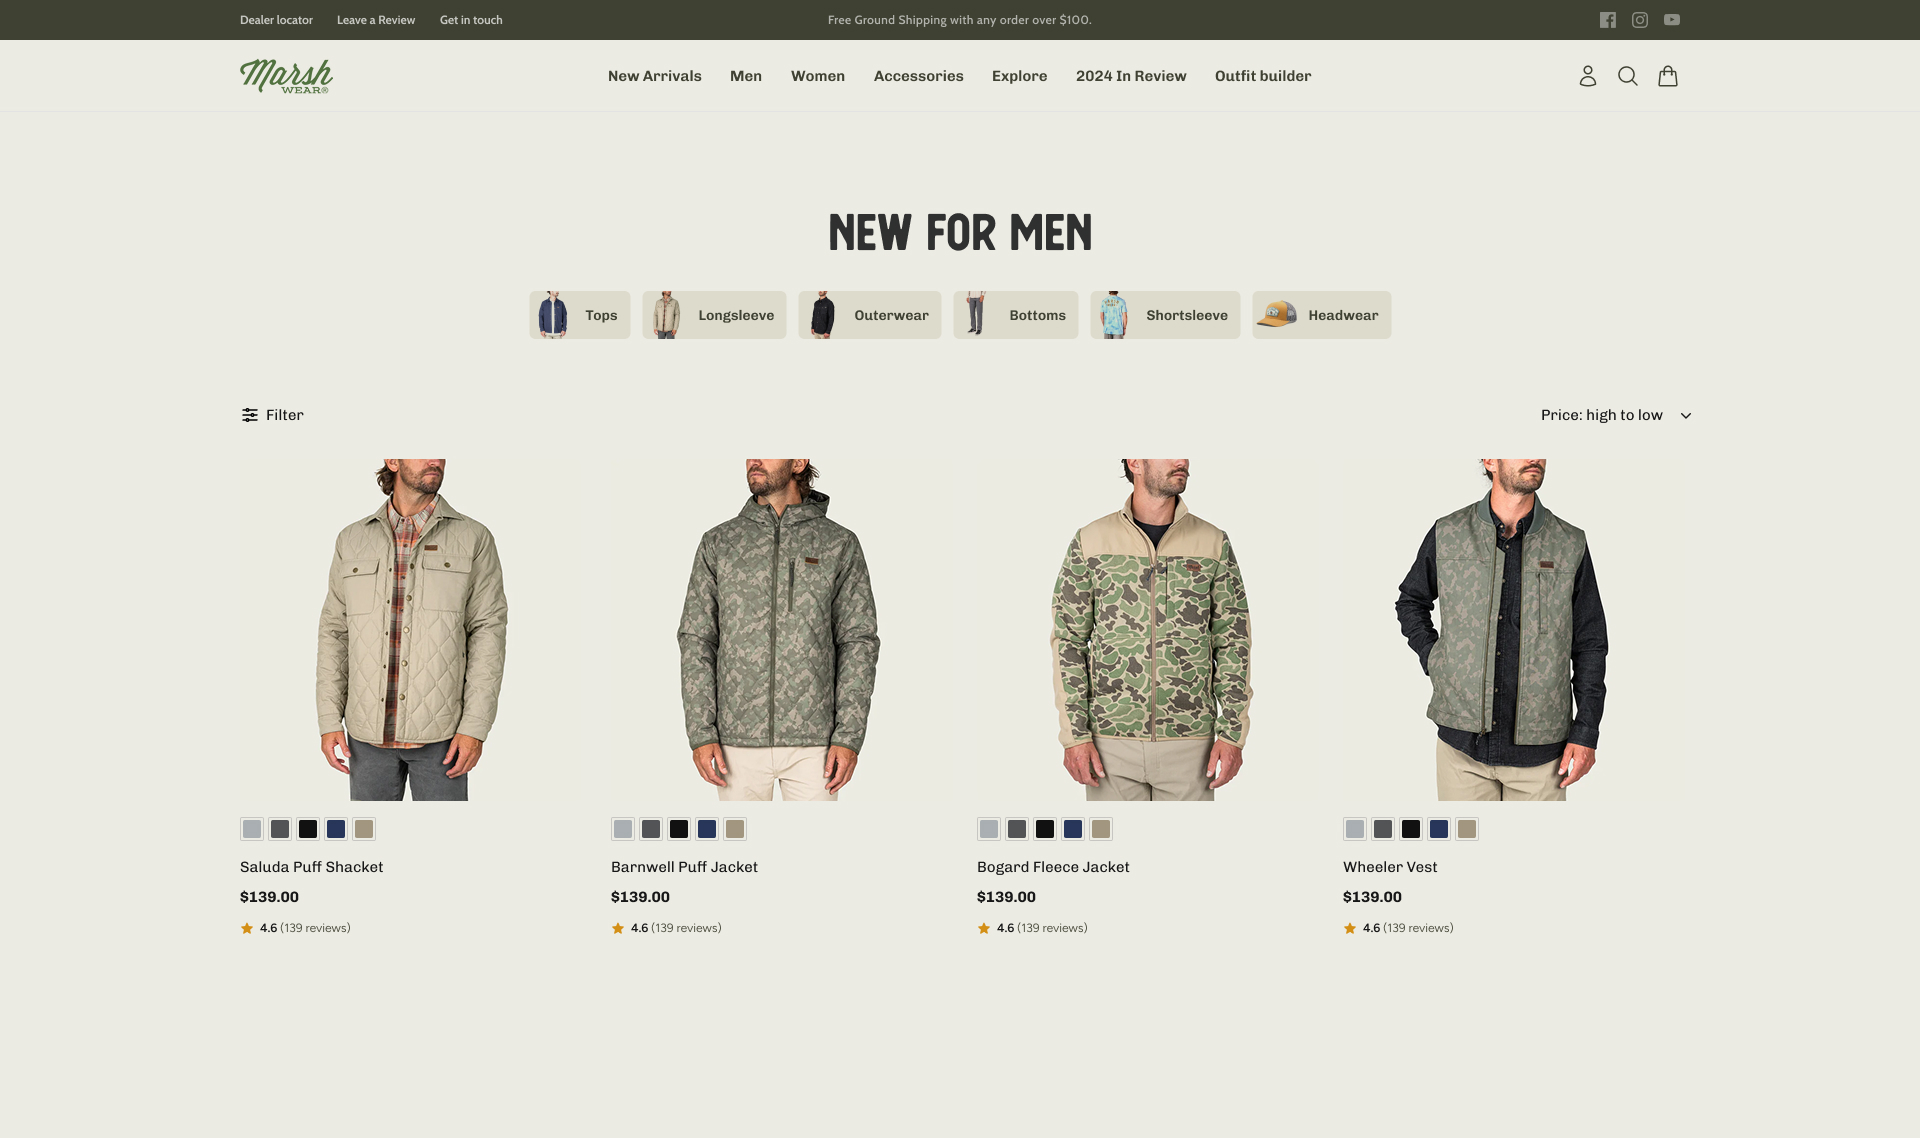
For TooTimid: 25% of your customers are first-time explorers. A "New to This? Start Here" kit — curated, priced under $50, with the free gift included — gives first-timers a safe, low-commitment entry point. Starter kit buyers have 3.1x higher 12-month LTV across our client base.
Added a "Buy 2, Get 15% Off" incentive badge directly on the product card in the cart, paired with a cross-sell carousel at the bottom. Encouraged customers to add a second item from the same category.


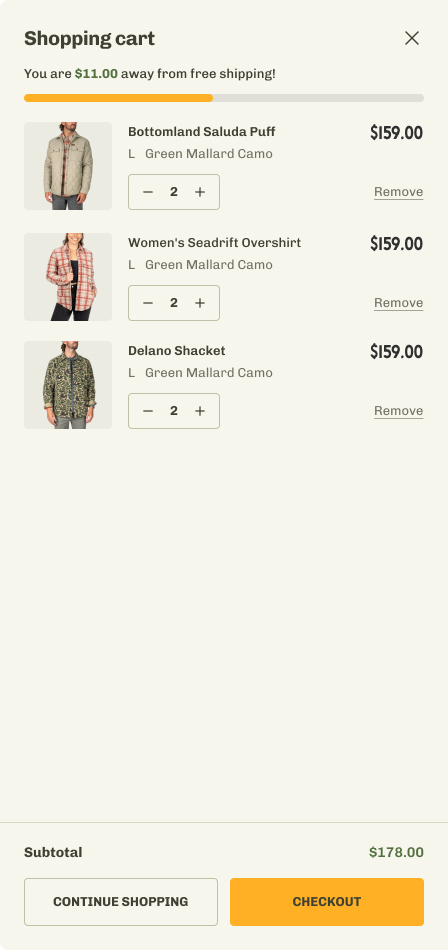
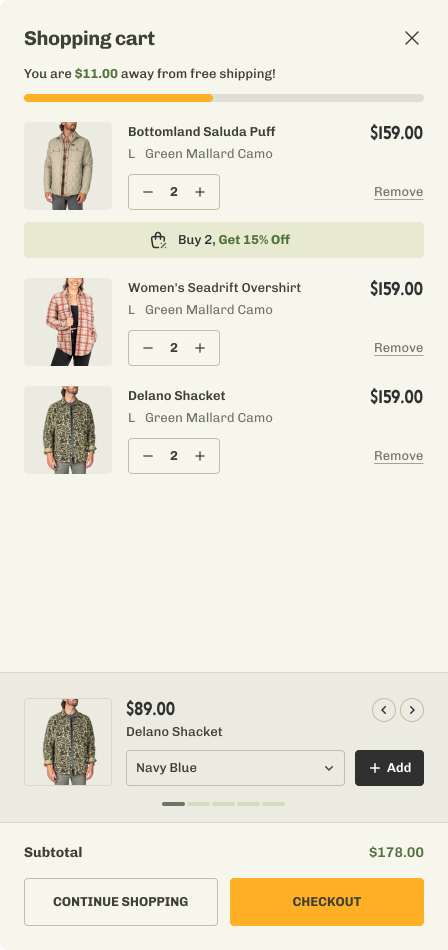
For TooTimid: Volume incentives work well with accessories and consumables where cost of goods is low. Testing a structured offer vs your current 50% flat discount would tell us whether structured offers drive better unit economics.
Tier 2 experiments change the structure of the buying experience — how customers discover, navigate, and move through the funnel. They're the changes that make the existing value proposition easier to find and act on.
Made the desktop navigation bar sticky so it stays visible while scrolling.


For TooTimid: Your site has a large catalogue across many categories. Persistent navigation helps visitors browse without losing their place.
Added a "Your Story, Our Hats" user-generated content section. Real customers wearing the product.


For TooTimid: UGC is tricky in your category for privacy reasons, but curated lifestyle content or anonymous review highlights could serve the same trust-building function.
Added a "Pairs well with" pop-up showing complementary products when a customer adds to cart.


For TooTimid: Complementary items (lube, cleaner, batteries, accessories) are natural add-ons at the point of commitment.
Added a "Get free socks!" callout with product image directly above the Add to Cart button.


For TooTimid: Your free gift with every order is buried. Surfacing it on the PDP with the retail value visible would give first-time buyers an extra nudge.
Replaced a product-heavy homepage with a lifestyle hero and "Shop by Category" grid.


For TooTimid: Your homepage has the highest bounce rate on the site. Guided entry with clear category paths would reduce choice paralysis.
Added feature callouts and benefit bullet points to collection page product cards.


For TooTimid: Your collection pages show multiple products with confusing prices. Cleaner product cards with clear differentiation would reduce friction.
Switched mobile collection from two-column grid to single-column with full-width lifestyle photos.


For TooTimid: In your category, product images need to do heavy lifting. More visual real estate on mobile would improve browse-to-click rates.
Redesigned mobile navigation to highlight three main products at the top with images and descriptions.


For TooTimid: Your mobile navigation needs to guide visitors through an unfamiliar catalogue. Visual category cards at the top would reduce guesswork.
Redesigned the promotional popup from a generic split-screen layout to a mobile-optimized, product-focused design. Combined with a 60-second delay.


For TooTimid: If you're running popups that fire on page load, delaying them and redesigning for mobile could reduce the "close and leave" reflex for first-time visitors.
Replaced the standard browse-and-add-to-cart flow with a guided quiz that recommends products based on customer answers.


For TooTimid: A "What's right for me?" quiz could be one of the highest-impact changes for your store. 25% of your customers are first-time buyers facing decision paralysis.
Added a sticky countdown timer bar to the top of the site during a clearance sale. Urgency tied to a real event, not a fake evergreen countdown.


For TooTimid: Countdown timers work best tied to real events. Tying a timer to genuine limited-time offers creates urgency without cheapening the brand.
A fair question after reading those case studies is whether we're just showing brands that were already growing. The honest answer is no.
When we started working with Q30, Marsh Wear and Codeword, every one of them was investing in traffic and pushing harder on growth. Whether sales would follow at the same rate was an open question. That is the exact stage where CRO does its best work, and it's where TooTimid is today.
You're spending around $200K a month on ads. You have 400,000 visitors coming through your store every month. The traffic engine is built and running. The question is how much of that traffic turns into revenue, and what's quietly leaking out of the funnel before it gets to checkout.
CRO is not a growth engine on its own. It needs traffic to operate on. You already have that part. The job is closing the gap between the traffic you're paying for and the revenue you're capturing from it. That gap is what we solve, so as your traffic grows, sales grow at the same rate or faster.
There's one more thing that makes your store a strong fit for this kind of work. Your customers are anxious buyers. They're buying something personal, potentially embarrassing, and they need to trust the site before they'll commit. That's a psychological friction problem, and psychological friction is exactly what our testing framework is built to identify and reduce. Every experiment we run on your store will be grounded in how your specific customers think, feel, and decide.
We've already invested time understanding your customers and your store. Between the psychographic customer profile we built from 80+ of your real customer reviews and a preliminary site analysis from our team, we have a clear picture of where the highest-leverage Tier 1 opportunities are.
1. Discount structure test. Your permanent "SEXY50" code for 50% off is the single biggest lever we'd want to test against. We'd run a controlled experiment: current 50% discount vs free gift only (no discount code) vs tiered spend-and-save thresholds. The goal is to find out whether the discount is actually driving conversions, or whether you're giving away margin on customers who would have bought anyway.
2. Price point testing on hero SKUs. We'd test price increases on your top 5-10 products. The research says 54% of brands find a better price point, and 59% of the time it's a lower price — but 41% of the time, a higher price converts better. We won't know until we test.
3. Free shipping threshold optimization. Test your current $59 threshold against higher values ($79, $99) paired with a progress bar in the cart. Your catalogue is deep enough that customers can easily add complementary items to hit a higher bar — lube, cleaner, lingerie, accessories.
4. Bundle introduction. Couples kits, first-timer starter kits, category bundles. Positioned as the recommended purchase, not a sidebar widget. Bundles reduce decision paralysis for first-time buyers while lifting AOV.
5. Post-purchase one-click upsell. We're not sure if you're currently running post-purchase upsells, but this is something we'd like to experiment with. A single-tap upsell page between checkout and order confirmation, where the customer has already overcome the privacy anxiety and entered payment details. We'd try different combinations of products and offers to find the highest-converting post-purchase flow.
6. Gift with purchase value reframe. Test making the free gift's retail value visible on every product page and in the cart. "You're getting a FREE [product] worth $45!" This reframes the purchase as a better deal without discounting the primary product.
7. Subscription and LTV opportunities. We'd look for opportunities to build lifetime value through a subscribe & save model on consumable products (lube, toy cleaner), or a dripped-out package offer. This might not be straightforward given how particular customers are about their product choices in this category, but we would actively look for opportunities to explore it regardless. Even a modest subscription uptake on consumables would generate predictable recurring revenue at zero incremental acquisition cost.
Month 1. Deep diagnostic (we need access to Shopify, GA4, Klaviyo). Validate assumptions. Ship the first 2-3 Tier 1 experiments — discount structure test, price point test, shipping threshold test. These are the fastest to set up and the most likely to produce large, measurable results quickly.
Month 2-3. Launch bundles, post-purchase upsells, and the free gift reframe. Blend in the first Tier 2 experiments (cart simplification, homepage guided entry, add-to-cart visibility).
Month 4+. Expand based on what the first three months teach us. The full Tier 2 backlog is ready. Tier 3 changes (copy, imagery, layout polish) come after T1 and T2 are optimized.
| Metric | 2024 | 2025 | Change |
|---|---|---|---|
| Net Revenue | $2.58M | $3.09M | +$504K (+20%) |
| Conversion Rate | 0.92% | 1.53% | +67% |
| Add to Cart | 20,399 | 29,573 | +45% |
| Sessions | 1,223,544 | 899,092 | -27% |
| Returns | 2,365 | 1,808 | -24% |
Revenue growth on less traffic. Better traffic quality plus a dramatically better on-site experience.
Q30 makes the Q-Collar. A $199 FDA-cleared neck device that reduces brain movement during head impacts. Selling a science-backed $199 product to anxious parents who've never heard of the category.
Different product, same buyer psychology. Q30 and TooTimid share the traits that matter most for CRO: high-anxiety buyers making a considered purchase in an unfamiliar category, where trust and education are the difference between a bounce and a sale.
| Dimension | Q30 | TooTimid |
|---|---|---|
| #1 Driver | Security (94/100) | Security (90/100) |
| Core objection | "Does this actually work?" | "Is this site safe and discreet?" |
| Buyer type | System 2 (research-heavy) | System 2 (research-heavy, high neuroticism) |
| Key friction | Product education gap | Privacy anxiety + choice paralysis |
The three insights that drove Q30's results — understanding who the real buyer is, recognizing they're deliberate researchers, and learning that simplification can hurt when the audience needs more information — are directly applicable to TooTimid. Your customers need reassurance and guidance, not a stripped-back experience.

"Tim and the Clean Commit team have been my secret weapon. I didn't have time to keep looking for ways to improve our store, and they've found optimizations I wouldn't have thought of. They're super responsive and require very little oversight."
Charlie Kunze, Director of Marketing, Q30 Innovations
| Metric | Before | After | Change |
|---|---|---|---|
| Conversion rate | 1.83% | 2.38% | +30.3% |
| Average order value | $99 | $114 | +14.8% |
| Monthly revenue | $308K | $741K | +140.7% |
Conservative annualised revenue impact: $590,458 (projected at 0.75% of measured test outcomes, 18 implemented winners, 37 tests over 12 months).
Premium outdoor apparel. Fishing, hunting, camping, boating lifestyle clothing. Around $5M/year on Shopify, 75%+ mobile traffic, conversion rate stuck below 2%. Owned by AFTCO, a brand we'd already been running a full CRO program on.
The marketing team was constantly updating the site, but every change was a guess. Layers of technical debt, no measurement, 75% of traffic on a mobile experience built as a desktop afterthought.
The counterintuitive finding from 40 hours of diagnosis: the biggest wins came from making products look better and feel more desirable, not from reducing friction. Marsh Wear's customers are driven by brand belonging and product desire. They want UGC, real photography, the feeling of "I want to wear that." What they don't want is urgency tactics, which cheapen the brand.
| Test | RPV Lift | Annual CII |
|---|---|---|
| Enhanced Search Results | +14.7% | $296K |
| Mini Cart Redesign | +9.9% | $36K |
| Discount Price Styling | +10.0% | $32K |
| Product Card Redesign | +9.3% | $30K |
| Mobile Menu Redesign | +10.7% | $22K |
| Hand-Picked Cross-Sells | +29.0% AOV +13% | $13K |
Most cross-sell implementations use algorithmic "frequently bought together" recommendations. We manually selected every product pairing. Fishing shirt with a specific hat. Jacket with matching gloves. Cheap, complementary, curated by humans who understood the products.
Result: +29% RPV, +13% AOV. Highest per-visitor revenue lift in the program. Timing plus relevance beats algorithms.

"Kamila, Tim and WK from the Clean Commit team are awesome. They run a tight ship and their program has been one of the main factors behind our growth this year."
Casey Sandoval, eCommerce Director, Marsh Wear
| Metric | Before | After | Change |
|---|---|---|---|
| Conversion rate | 2.28% | 2.69% | +18.2% |
| Average order value | $113 | $146 | +28.6% |
| Monthly revenue | $212K | $287K | +35.5% |
Conservative annualised revenue impact: $915,128 (projected at 0.75% of measured test outcomes, 11 implemented winners, 35 tests over 12 months). Year-over-year gross revenue: $2.05M to $3.87M. +88.6%.
Custom hat company. Order a single embroidered hat with no bulk minimum. Customers type in text, choose a style, pick placement. Around 85 to 90% of hats get customized, so the customizer is the product experience.
Conversion stuck at around 2% with no clear path forward. The off-the-shelf customizer plugin couldn't be A/B tested, had limited styling options, looked visually cheap and was completely locked down. For a store where 85%+ of customers have to use it to buy anything, that wasn't a minor UX issue. It was a revenue ceiling.
| Test | RPV Lift | CVR Lift | Annual CII |
|---|---|---|---|
| Customizer Rebuild | +32.6% | +6.8% | $375K |
| Condensed Product Gallery | +62.9% | +23.9% | $164K |
| Review-Based FAQs | +33.2% | +8.4% | $81K |
| Input-First Mobile Customizer | +12.0% | +2.8% | $57K |
| Enhanced Mobile Customizer | +21.7% | +3.0% | $54K |
The customizer preview was blank by default. Customers stared at an empty hat mockup, trying to imagine what their text would look like.
We added one thing. Placeholder text in the preview. "YOUR TEXT HERE" shown on the hat by default.
Result: +15.1% CVR, +9.4% RPV. One line of copy. 15% conversion lift. This is what research-backed CRO looks like.
The biggest win wasn't a traditional A/B test. It was rebuilding the customizer plugin from scratch and then testing the new one against the old one.
New customizer: better styling, cleaner UI, mobile-first, real-time preview with zero lag, every element testable going forward. It also integrated with Nate's embroidery machines, automating a workflow that was previously manual.
+32.6% RPV, +6.8% CVR, +24.3% AOV. $375K annual impact from a single experiment.

"Our conversion rate is already up 10-15% just in a month or two of working with them. If you're on the fence, just do it. You will not regret it. They're a great team, they really work to understand you and your particular business."
Nate Montgomery, Founder, Codeword (video testimonial)
We've run comparable engagements across multiple ecommerce brands over the last 14 months, and the pattern is consistent. Structured CRO testing on stores with strong traffic produces meaningful, measurable revenue growth.
We're going to be conservative with these projections. We haven't been inside your analytics yet, and we don't know your exact AOV or revenue baseline. What we can do is show you what a realistic range looks like based on what we've seen across similar engagements.
Based on TooTimid's metrics (around 400K sessions/month, ~2% CVR, estimated $75 AOV, baseline ~$600K/month from the site):
| Conservative | Expected | Optimistic | |
|---|---|---|---|
| Based on | Slowest comparable engagement | Average across three of our CRO clients | In line with our best performing stores |
| CVR improvement | +10–15% (to ~2.2–2.3%) | +15–20% (to ~2.3–2.4%) | +25–30% (to ~2.5–2.6%) |
| Monthly revenue lift | +$60K–$90K | +$90K–$120K | +$150K–$180K |
| 12-month cumulative | +$720K–$1.08M | +$1.08M–$1.44M | +$1.8M–$2.16M |
These projections assume static traffic and static ad spend. They also assume an estimated $75 AOV which we'll validate once we have access to your analytics. The actual numbers could shift in either direction once we see the real baseline.

"CR has gone up roughly 800% since we started working on the store… which is pretty neat."
Rachael Nelson, eCommerce Manager, Peluva

"Conversion rate went up almost 300%."
Sarah Smyth, Australian Black Worms

"Fantastic, communicative, and made constant progress."
Tim Ruswick, GameDev.tv
Every engagement runs the same three phase cycle.
25 to 40 hours of deep analysis before we touch anything. We're hunting for the real reasons people buy, and the quiet reasons they don't, across your store, your reviews, the wider web and the category at large.
5 to 10 A/B experiments running concurrently at all times, each one pressure-tested against The 11 Pillars of Buying Psychology before it goes live. Winners get implemented, losers get dissected so the next test lands harder.
Winning experiments are permanently built into your store, each one lifting the baseline the next test builds on. Monthly reporting ties every experiment back to revenue impact.
100 experiments per year × 30% win rate = around 2.5 winners every month.
Roughly 30 permanent improvements per year, each one raising the baseline the next test builds on. A single winning test on Marsh Wear's mobile menu generated +$109,400 in annual revenue, and that was one of thirty that year.
We work on a performance-based model. Our fee is tied directly to the revenue our experiments generate. If the experiments don't produce results, you don't pay. If they do, you pay a fair share of the value we created.
Month one, there is no retainer. You pay only for results. At the end of the month, we calculate the incremental revenue generated by experiments that reached statistical significance. The performance fee equals this incremental revenue amount. If no experiments produce a positive result, no fee is charged.
From month two, a monthly minimum of $3,000 applies. This is a floor, not a cap.
If the performance fee for the month is less than $3,000, you pay $3,000. If the performance fee exceeds $3,000, you pay the performance fee. You pay the higher of the two, not both.
The minimum ensures both parties share the risk. You receive a dedicated CRO team working on your store every month. We receive a baseline that covers a portion of the effort involved, even in months where experiments don't produce measurable wins. In those months, you still benefit from the research, learnings, and strategic direction.
In the example above, the variant generated $14,893 and the control generated $13,493. The difference is roughly $1,400. That's what we'd charge as the performance fee — one month of the measured uplift.
Every month after that, the $1,400 in extra revenue is yours. The experiment keeps running, the lift keeps compounding, and we earn nothing on it past that first charge.
Revenue impact is measured through the agreed testing platform (Intelligems). Every experiment is an A/B test: a portion of your traffic sees the original (control) and a portion sees our change (variant). Because both groups are drawn from the same pool of visitors at the same time, external factors affect both groups equally. The measured difference isolates the impact of our work.
An experiment qualifies for billing when it reaches at least 90% probability to beat baseline on the primary revenue metric, with directional support from at least one higher-powered funnel metric (add-to-cart rate or checkout commencement rate).
If an experiment doesn't reach 90%, we declare it flat. From there it's a mutual call whether to roll the change out anyway or bin it. If you choose to ship it before it reaches significance, it qualifies for billing — if you're shipping it, you're agreeing it has value.
There's no hard lock-in. This agreement is month-to-month. Either party may terminate by providing 21 days' written notice.
We strongly recommend sticking with us for at least three months before drawing conclusions. That's the minimum time for us to learn your customers well enough to stop running broad experiments and start running the sharp, customized ones that tend to produce the biggest wins.
If we go a few months without a real win, we're the first ones who'll tap you on the shoulder. We're not incentivized by the minimum. The minimum is close to a wash for us. We're incentivized by the big wins. If those aren't happening, the shared incentive isn't there and we'll tell you straight.
You've seen the case studies, the process, the pricing and the specific plan we've already started building for your site. The only real decision from here is whether to start.
We'll walk through your current metrics, pressure-test the plan against anything we haven't seen yet and confirm the opportunity size.
Tim Davidson
tim@cleancommit.io
Total elapsed time from signed agreement to live tests: 14 days.
We currently have room for two new engagements this quarter. If we're at capacity when you reach out, we'll tell you straight and offer a start date rather than overcommit.
If the answer is "not yet," the most useful thing we can do is send you the customer insight report (Appendix A) as a standalone document. We built it from 80+ of your real customer voices — their anxieties, their motivations, what almost stopped them from buying. It's yours either way. Either the work speaks for itself, or it doesn't.
We don't have access to your Shopify console yet, so the figures below are based on what you've shared with us and what we can observe externally. They could be off, so take these projections as directional rather than precise.
The point here isn't a precise baseline. It's showing you roughly what the trajectory looks like when a brand like yours runs a structured CRO program.
| Current (estimated) | Shopify Health & Beauty Benchmark | Clean Commit average CVR lift (6 months) | |
|---|---|---|---|
| Conversion Rate | ~2.0% | ~2.5–3.5% | +15–20% |
This isn't gospel. We need to go much deeper on the analysis once we have access to your analytics. But between the customer research we've already done and our team's preliminary review of your store, we've identified several structural issues worth testing against.
From our preliminary analysis and customer research (80+ customer voices across Trustpilot, Bizrate, and BBB):
These are the kind of structural problems that a CRO program is designed to solve, and every one of them is testable.
Clean Commit has been around since 2018 and is considered one of Australia's leading conversion rate optimization agencies. Our team is spread globally across Europe, America and Australia. We help Shopify brands turning over between $2M and $50M in revenue who have hit a growth ceiling.
We're a small team made up of experts in their fields. Senior project managers who have worked on large enterprise software platforms and infrastructure rollouts. Senior developers with a decade of experience designing web systems, UI and UX. Analysts with tertiary backgrounds in psychology, analytics and statistical analysis. Because we're all experts in our respective fields, we look at websites through a different lens than other teams.
We're focused on one thing. We're not a full-service agency. We don't do ads, email marketing or social media. What we do is scientific testing, customer analysis and conversion rate optimization for Shopify. It's our specialty and we know it inside and out.
| Brands optimized | 106+ brands |
| A/B tests run | 1,000+ with real traffic and statistical rigor |
| Revenue generated (last 12 months) | $1.5M in measured, attributable lift |
A small, senior team. You work directly with us, not a layer of account managers.

Tim Davidson
Founder & Lead Strategist

Wojciech Kaluzny (WK)
Co-Founder & Lead Engineer

Kamila Kucharska
Project Manager

Patryk Michalski
Senior Web & UX Designer

Cormac Quaid
Shopify Engineer

Borisa Krstic
Shopify & React Engineer
Plenty of agencies do upfront research. Where we tend to separate is how far we push past surface-level UX and into the psychology of why your customers buy.
Ever wondered why certain products fly off the shelves while others gather dust? There are rules behind that. Real patterns in consumer psychology that can be applied to make a lot of money.
Over the last seven years we've built a framework called The 11 Pillars of Buying Psychology to record what actually drives your customers to buy, and what quietly stops them. Every experiment we propose gets pressure-tested against those pillars before it goes live.
A lot of agencies optimize components. We optimize buying decisions.
We aim to run over 100 experiments a year for each of our active clients. We operate at roughly a 30% win rate, which means about 30 wins every year compounding into your baseline.
A single test is a coin flip. Run 100 of them through a disciplined framework and the math tilts in your favor. From what we've seen, a lot of our competitors and internal teams only run 20 to 30 tests a year. We run two to three times that.
Built from ~80 of your real customer voices across Trustpilot (7,565 reviews, 3.6/5 rating), Bizrate (8.3/10, 1,527 reviews), BBB, and Knoji. This is the kind of report we produce in the first two weeks of every engagement.
The defining trait: Your customers are anxious buyers. They chose TooTimid specifically because they're too uncomfortable to walk into a physical store. The brand name itself is the value proposition — this is the safe, discreet, non-intimidating way to shop for something they find embarrassing.
Who they are:
| Segment | Share of customers | Trigger |
|---|---|---|
| Couples looking to "spice things up" | ~35% | Relationship routine, desire for novelty, often one partner initiating |
| Solo self-care / first-time explorer | ~25% | Curiosity, self-discovery, TikTok or social media discovery |
| Repeat buyer restocking or upgrading | ~20% | Previous product broke or wore out, prompted by email or promotion |
| Gift buyer (for partner) | ~10% | Anniversary, Valentine's, birthday, spontaneous romantic gesture |
| Replacing a broken product | ~10% | Product stopped working, need replacement or upgrade |
The first-time explorer segment is the most underserved. They need reassurance above all else, plus low-commitment entry points (free gift, starter kits, educational content). They're the most likely to bounce without buying.
Seven psychological drivers, scored by frequency and strength in customer language:
| Driver | Strength | Customer Language |
|---|---|---|
| Security | 90/100 | "Discreet shipping." "Discreet packaging." "What you put down from your bank account." |
| Comfort | 80/100 | "Very easy and fast, simple process." "Easiest most pleasant experience I've ever had." |
| Curiosity | 55/100 | "I got a free toy for it being my first time ordering!" "Liberating...self care point of view." |
| Belonging | 45/100 | "It's our private ToysRus store." "My wife and I really enjoy this site!" |
| Progress | 35/100 | "Liberating...self care point of view." "Enhance your personal satisfaction." |
| Autonomy | 25/100 | "Vast selection...just about everything I'd ever want." |
| Status | 10/100 | Almost entirely absent. This is not an aspirational purchase. |
The phrase to build everything around: Security and Comfort together account for the overwhelming majority of positive review language. Every page on the site should answer two questions: "Am I safe here?" and "Is this going to be easy?"
| Rank | Objection | What They're Thinking |
|---|---|---|
| 1. "Is this site legitimate?" | Scam Detector gives 70.4/100. First-time visitors from TikTok or social ads are especially skeptical. Need trust badges, years in business (since 2000), review count (7,500+), and secure checkout callouts above the fold. | |
| 2. "What if someone sees the package or billing?" | The #1 anxiety. Currently addressed by the brand but may not be visible enough on product pages and at checkout. Needs prominent, specific guarantees: plain brown box, no company name on exterior, billing shows as generic name. | |
| 3. "What if it's defective and I can't return it?" | No-return policy on adult products is a major friction point. Replacement policy exists but isn't well-understood. Needs clearer communication: "Defective? Free replacement, no questions asked." | |
| 4. "Prices seem high" | Competitors run aggressive promotions. TooTimid's free gift partially offsets this, but the value may not be clear until after purchase. Need visible value framing. | |
| 5. "I don't know which to choose" | First-time buyers face decision paralysis in an unfamiliar category. Educational content exists but may not surface at the right moment. Needs guided selling. | |
| Trait | Level | Implication |
|---|---|---|
| Neuroticism | High | The defining trait. Anxious about being discovered, about package contents, about billing statements, about whether the site is safe. Every step needs abundant reassurance. |
| Conscientiousness | Moderate-High | Research before buying. Watch product videos. Read policies carefully. Give them everything on-site. |
| Extraversion | Low-Moderate | Private purchase behavior dominates. They would NOT walk into a physical store. Avoid social proof that feels exposing. |
| Agreeableness | Moderate-High | Warm and forgiving when things go right. Sharp and unforgiving when trust is broken. |
| Openness | Moderate | Curious enough to shop online for intimate products, but they chose the "safe" brand. Not early adopters. |
Design implication: High neuroticism + moderate conscientiousness = these customers need reassurance at every step. Don't get clever with checkout. Show security badges prominently. Explain exactly what will appear on their credit card statement. Show what the package looks like. Keep the experience simple and non-overwhelming. Avoid social proof tactics that feel exposing ("X people are viewing this") — these buyers don't want to feel watched.
Built from ~80 distinct customer voices across 6+ sources, with 7,565 Trustpilot reviews providing quantitative backing. Known gaps: no Reddit presence found, Yelp blocked, homepage couldn't be scraped (JS/Shoplift layer), no access to on-site product reviews yet. Confidence will increase significantly once we have access to on-site reviews, post-purchase survey data, and analytics.
Every experiment in this proposal traces back to something one of your own customers said. We don't test random changes. We test changes grounded in how your specific customers think, feel, and decide.
We use a naming and intent convention that categorizes each part of the UI and cross-references it with the motivations of the customer. Someone looking for information on a PDP is on a different journey to someone flirting with purchasing on the same page, so we treat those as separate spaces.
When we scope an experiment, we stick to one defined part of the site with one defined intent. We can go surprisingly granular, and at that level of resolution it takes at least 18 months to exhaust all the combinations on a single store. So cannibalization is something we sidestep structurally, not something we manage case by case.
Every test is a controlled A/B. A percentage of your traffic sees the original (control), the rest sees the variation.
We measure a range of metrics. Conversion rate, revenue per visitor, average order value, bounce rate and a handful of supporting signals, all pulled directly from the testing platform.
We also run an AA test on each store before we start. That tells us the natural variance of your pages. If we know your baseline conversion rate naturally swings by around 5%, we won't call a 5% lift a win. That gets declared flat. It's the only way to separate real movement from statistical noise.
We push for above 90% statistical confidence before calling a winner. For stores with large traffic we'll reach into the 95%+ range. For smaller stores 90% is our working floor.
We default to Intelligems on most engagements.
Intelligems uses randomized participation, which means a single visitor can be part of three, four, five or more concurrent experiments without the results interfering. That matters because it lets us maintain a high testing velocity without the tests tripping over each other.
We've also used Shoplift extensively. It isolates audiences per experiment, which means the number of concurrent tests you can run is much lower and each one takes longer to resolve. We don't recommend it anymore for high-velocity programs.
We've run script-based tools as well (VWO, Optimizely, Convert) but for Shopify stores today, Intelligems is the best tool on the market.
We come to you and tell you.
We're incentivized by the wins, not the retainer, so a quiet stretch hurts us too. If we go a few months without a real win we'll suggest whatever we can think of to course-correct. If it still isn't landing, we'll be the ones who raise the idea of mutually ending the engagement. We're not precious about the contract. We're out to make big wins, and when the shared incentive isn't there, we'll say so.
We aim for up to 10 concurrent experiments and around 100 experiments per year. Our average win rate sits between 20 and 30%, which means 20 to 30 winners a year compounding into your baseline.
Yes. You don't need to coordinate with us.
We run GitHub Actions behind the scenes that pick up your changes and apply them to the live experiment so everything stays in sync. We aim to be relatively invisible in the background. You run your marketing, merchandising and content updates as normal.
Tim is based in Australia (AEDT). The rest of the team is distributed across Europe: WK, Kamila, Patryk, Borisa and Cormac.
Tim is the account lead and the escalation point for anything strategic or contractual. Kamila is the person you'll be talking to in Slack day to day, providing running updates and managing delivery. The bi-monthly sync call where we walk through new experiments and results is typically with Kamila and WK (our co-founder and lead engineer).
Yes. We encourage every client to connect with us on Slack. When you need something from a designer, developer or analyst, you can reach them directly in the channel.
Yes. Custom Shopify app development, headless builds, custom themes, international expansion, integrations and more.
That said, the point of this engagement is to improve your revenue per visitor. When a request comes in that's outside CRO scope, we tend to package it as a separately scoped piece of work so it doesn't interrupt the testing program.
Minimal.
| What | Time |
|---|---|
| Shopify and analytics access at kickoff | 10 minutes, one off |
| Weekly Slack updates from us | 5 minutes to read |
| Review of experiments before launch | 15 to 20 minutes per week |
| Feedback on test designs (async) | 10 to 15 minutes per week |
| Bi-monthly sync call | 1 hour every 2 months |
We handle the research, design, development, QA, launch, monitoring, analysis, reporting and implementation of winners.
Three months is roughly one full testing cycle. You'd expect the diagnosis to have surfaced 10 to 20 high-impact opportunities, 5 to 15 of those to have been tested, and 3 to 5 of those to have produced a measurable win.
In revenue terms, 3 months of testing on a store converting at 1.1% often lifts CVR into the 1.3 to 1.5 range, depending on traffic volume and the severity of the issues we find. The exponential compound doesn't really kick in until months 6 to 9, when the wins start stacking.
Yes. Happy to put you on a call with Nate (Codeword), Charlie (Q30) or Casey (Marsh Wear). Let us know which vertical matches your questions best and we'll arrange the intro.